

30 cm per Pixel: How I Built the Highest Resolution Lunar Terrain Map that ISRO Never Released
From Chandrayaan-2's ultra high-resolution lunar imagery to a 30 cm Digital Elevation Model — independently, using open-source planetary science tools.

This blog post provides technical documentation of the DEM generation workflow for reproducibility purposes only. A separate manuscript presenting the complete geodetic alignment methodology, quantitative validation, and statistical analysis is currently in preparation for journal submission.
preprint: arXiv:2602.14993
In my previous analysis of OHRC’s operational capabilities, I highlighted one of the instrument’s most compelling design goals: Ultra-High Resolution Stereo Imaging. By capturing multi-view stereo images within a single orbit through different spacecraft orientations, OHRC enables the creation of digital elevation models with equally high spatial resolution. ISRO’s Space Applications Centre (SAC) uses a purpose-built indigenous software called OPTIMUS to generate these DEMs internally, reportedly producing approximately 28 cm horizontal and 100 cm vertical resolution elevation data.

The DEM generation methodology was discussed in 52nd LPSC conference which includes the terrain characterization for Chandrayaan-3 landing site selection — work that clearly demonstrates the value of these elevation products, the OHRC-derived DEM unfortunately are not available to the public or to the broader scientific community. The imagery and the spacecraft’s position and attitude are released. But, the derived science products remain behind institutional walls.
Now, I want to be clear about something: I’m proud that India has a camera like this in lunar orbit. OHRC is, at the time of writing, the only operational orbital camera at the Moon capable of sub-25 cm imaging. NASA’s LROC Narrow Angle Camera (NAC) — the next best thing — achieves ~0.5 m/px optical resolution, and its best DEMs reach 2–5 m/px from stereo or ~1 m/px from photoclinometry at a handful of selected sites at the poles. NASA+KARI’s ShadowCam is optimized for permanently shadowed regions (PSR) at ~1.7 m. OHRC stands alone in its resolution class — and that is a genuine achievement by SAC and the teams that designed and built it. When I spotted the IM-2 Athena lander and, before that, Japan’s SLIM in OHRC imagery, it was a reminder of just how powerful this instrument is. As an Indian, there’s a real sense of pride in knowing that this capability exists, orbiting the Moon right now, capturing data that no other active mission can match.
Which is exactly why it’s frustrating that the derived products don’t get released — so I decided to build them myself.
Why Elevation Maps Matter More Than Pretty Images
Before getting into the technical journey, it’s worth understanding why a Digital Elevation Model (DEM) is fundamentally different from — and arguably more valuable than — the imagery itself.
An OHRC image tells you what the surface looks like. A DEM tells you what the surface actually is. It encodes the three-dimensional shape of the terrain: every slope, every depression, every boulder. From a DEM you can compute slope maps, identify safe landing zones, measure crater depths, estimate regolith properties from degradation patterns, and plan traverse routes for rovers. None of that is possible from a flat image alone.
This is exactly why DEM generation was identified as a key capability in the original OHRC instrument paper by Chowdhury et al. (2020).
A software pipeline has been developed to process OHRC DSS images (~3 km × 12 km), which is capable of generating DEM in 21 min after receiving the second orbit data. Regular operations products are according to defined levels. There are three levels (0, 1 and 2) defined for OHRC data products.
(…)
Level-2 datasets include both radiometric and geometric correction. DEM generation and Ortho correction using Lunar control points or reference data are planned for stereo acquisitions.
It isn’t an afterthought. It is one of the primary justifications for the instrument’s design — the narrow field of view, the high-resolution TDI detector, the stereo maneuvering capability. The instrument was built for this. The paper itself describes the stereo DEM capability as a core deliverable.
And yet, over five years after Chandrayaan-2 reached lunar orbit, the best publicly available elevation data for the Moon comes from NASA’s Lunar Reconnaissance Orbiter. LOLA provides global coverage at roughly 30 meters per pixel, with select high-density passes achieving about 1 meter. The gap between what OHRC can theoretically produce and what anyone outside ISRO can actually access is nearly two orders of magnitude.
The Open-Source Ecosystem That Made This Possible
I’ll be honest: I spent months on this. Not months of continuous processing — months of reading documentation, figuring out data formats, hitting dead ends, trying things that didn’t work, and slowly piecing together a workflow that does. And none of it would have been remotely possible without open-source tools built and maintained by people who chose to make their work available to everyone.
ISIS (Integrated Software for Imagers and Spectrometers), developed by the USGS Astrogeology Science Center, is the backbone of planetary image processing. It handles raw data ingestion, SPICE kernel management, and camera model computation. It has been open-source, supporting missions from Voyager to Mars Reconnaissance Orbiter to, now, Chandrayaan-2.
The Ames Stereo Pipeline (ASP), developed by NASA’s Intelligent Robotics Group at Ames Research Center, does the heavy lifting of stereo photogrammetry: feature matching, bundle adjustment, triangulation, and DEM generation. Open-source, actively maintained, and well-documented.
ALE (Abstraction Library for Ephemerides), also from USGS, provides the camera model abstraction that connects mission-specific sensor geometry to the Community Sensor Model (CSM) framework — which turned out to be the key that made OHRC processing practical.
Granted this can be overwhelming at the beginning, especially if you have no prior experience with these tools. And the support for Chandrayaan-2 data specifically OHRC and TMC2 only started to be available recently and it hasn’t been officially released yet, as the the development is being actively worked on.
The Chandrayaan-2 OHRC driver in ALE is still not finished yet but it does work, the PDS4 import template in ISIS, the ASP documentation page for Chandrayaan-2 — all of that exists. I genuinely appreciate that effort, and I think it deserves more recognition than it gets.
ISRO’s approach has been different. Their processing software is proprietary and rather fully in-house and, their derived products stay internal, and their data access policies can be inconsistent. I’ve written before about the level of opacity ISRO maintains regarding operational specifics. I understand there are institutional reasons for this — priorities, resources, policy — and I don’t think it comes from a place of bad intent. But from the perspective of someone trying to do science with Indian mission data, there is a real gap.
This is ultimately why open-source matters. When the institution doesn’t release the product, the tools let you build it yourself.
The Data: What You Get and What You Have to Hunt Down
OHRC stereo pairs are created by maneuvering the Chandrayaan-2 spacecraft on consecutive orbits — tilting roughly 5° on one pass and about 25° on the next — so the same terrain gets imaged from two different viewing angles. This creates the convergence geometry needed for 3D reconstruction.
The ingredients for DEM generation are:
Stereo image pairs in PDS4 format, released through ISRO’s PRADAN portal
SPICE kernels — attitude files and orbital position files, released separately on PRADAN
Calibration lookup tables — gain and bias per pixel, specific to the detector mode used during capture
Finding the right stereo pairs was its own challenge. I’ve been building a lunar data portal called Soma — something like ISRO’s CH-2 Browse or NASA’s QuickMap — that lets me search the OHRC catalogue by location, date, resolution, and solar geometry.
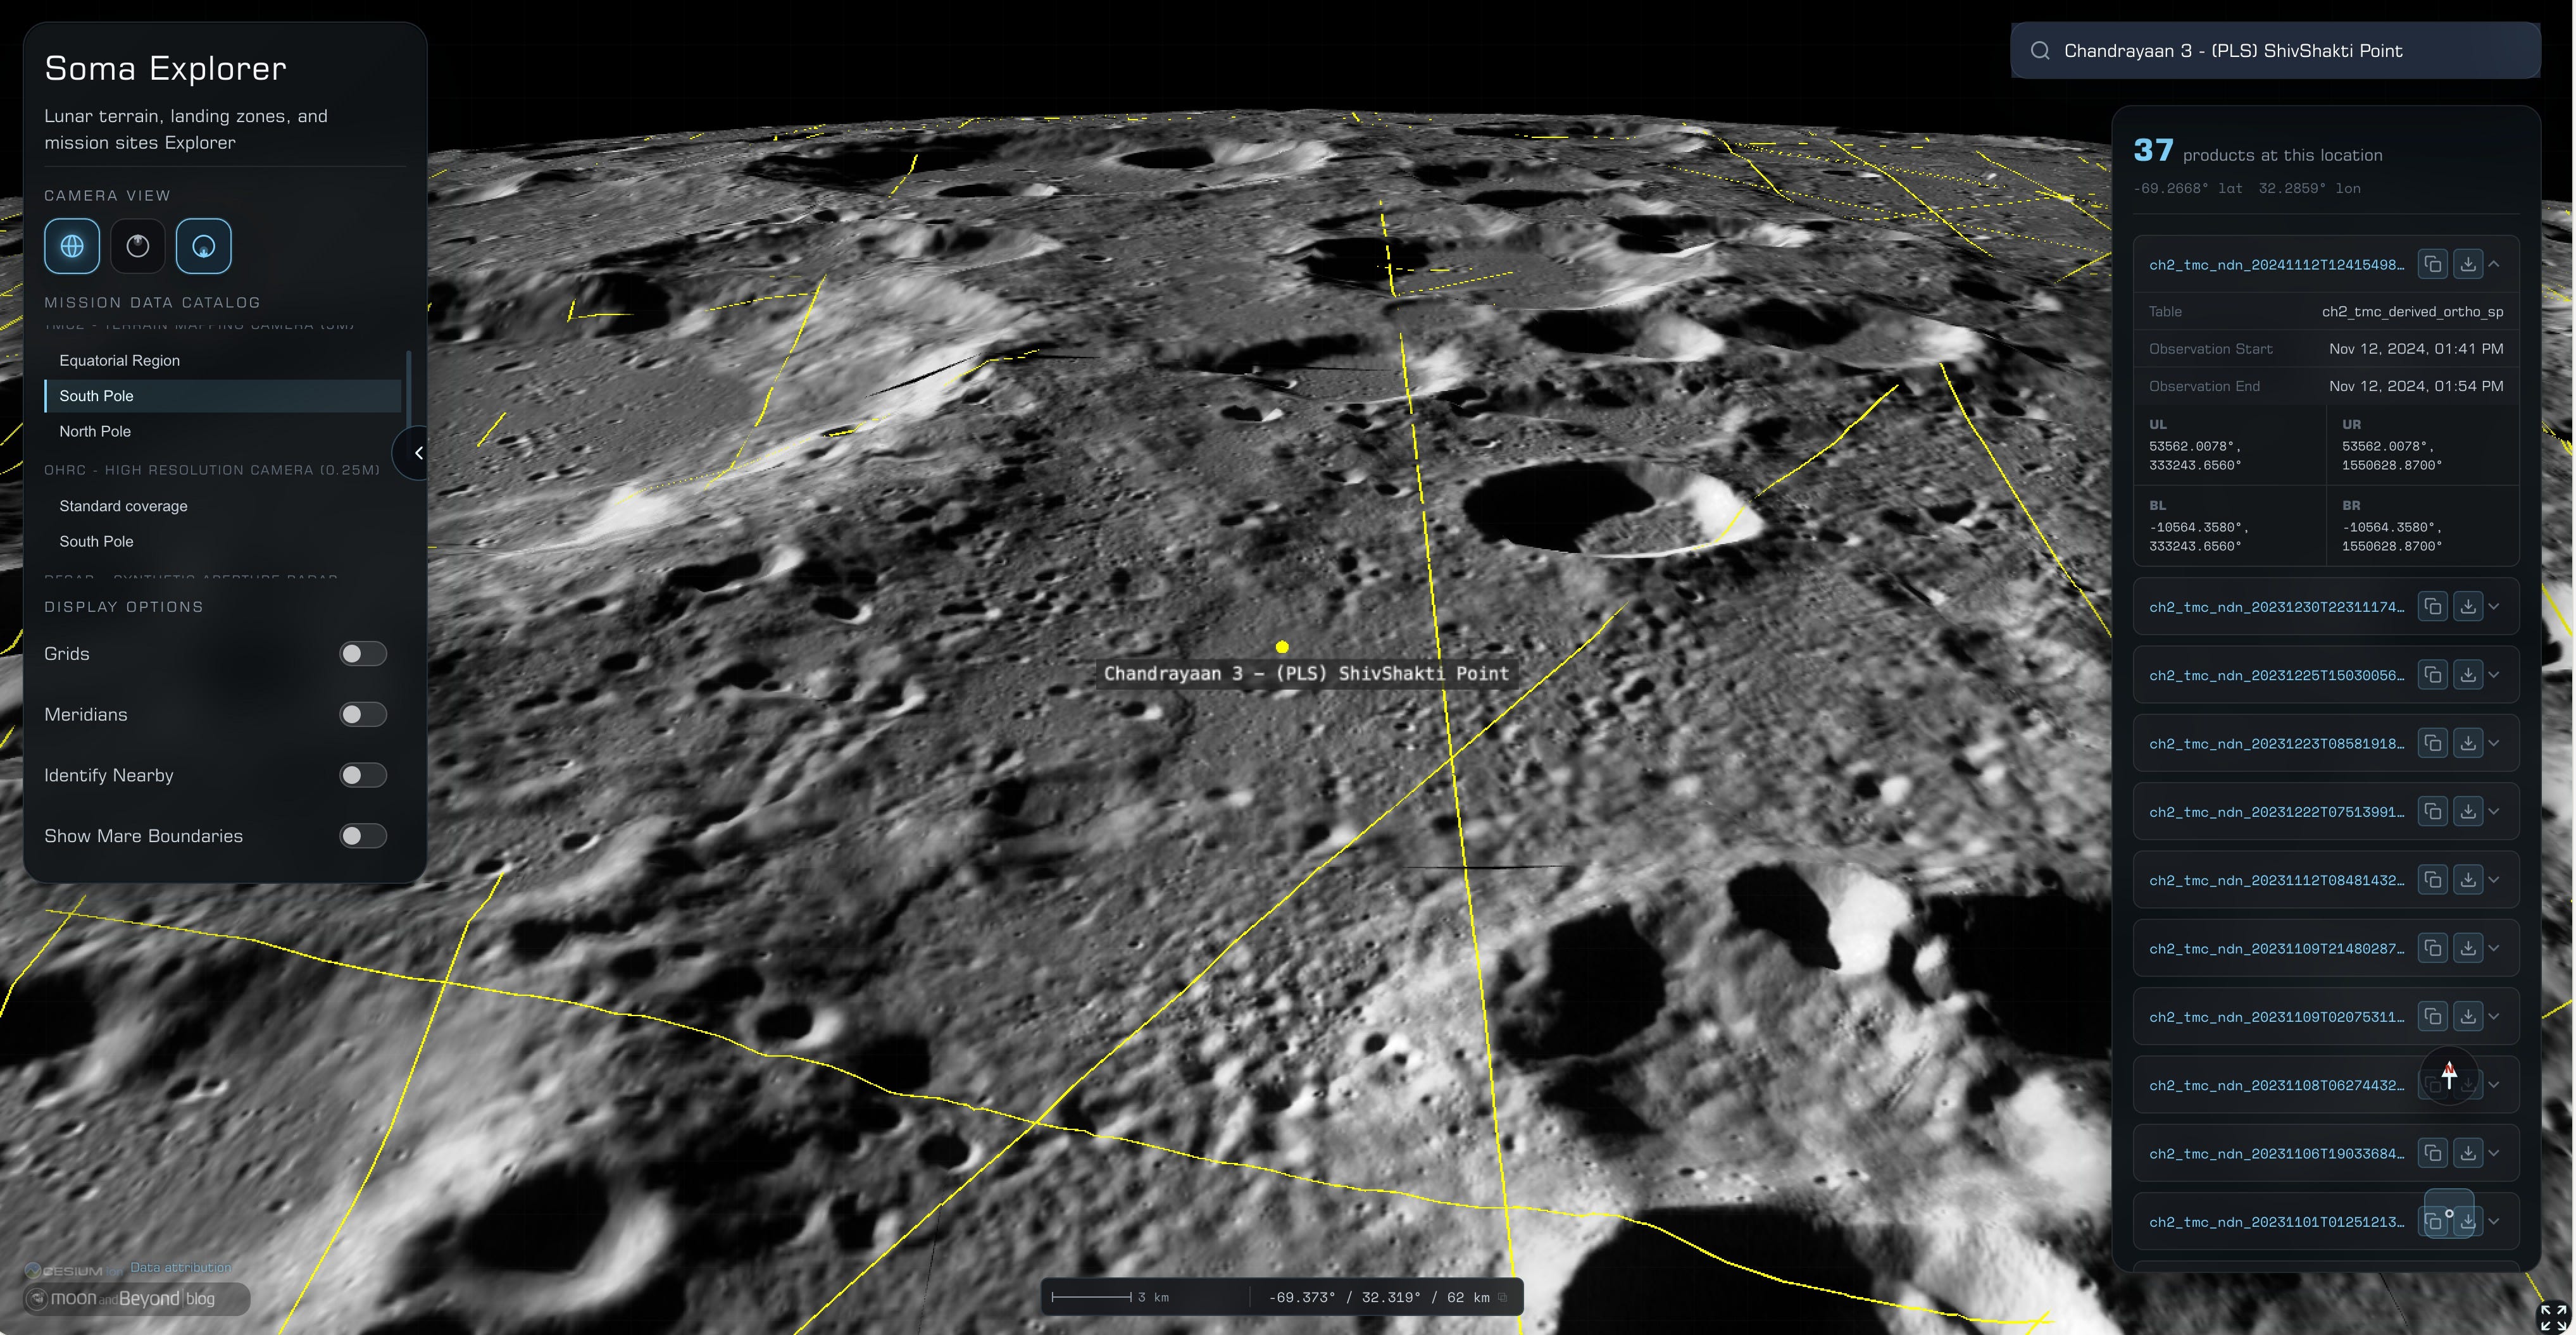
I haven’t released it yet, but I plan to make it available to the wider community soon. It proved essential here: without a way to quickly identify which image strips actually overlap and form viable stereo pairs, I’d still be scrolling through metadata tables.
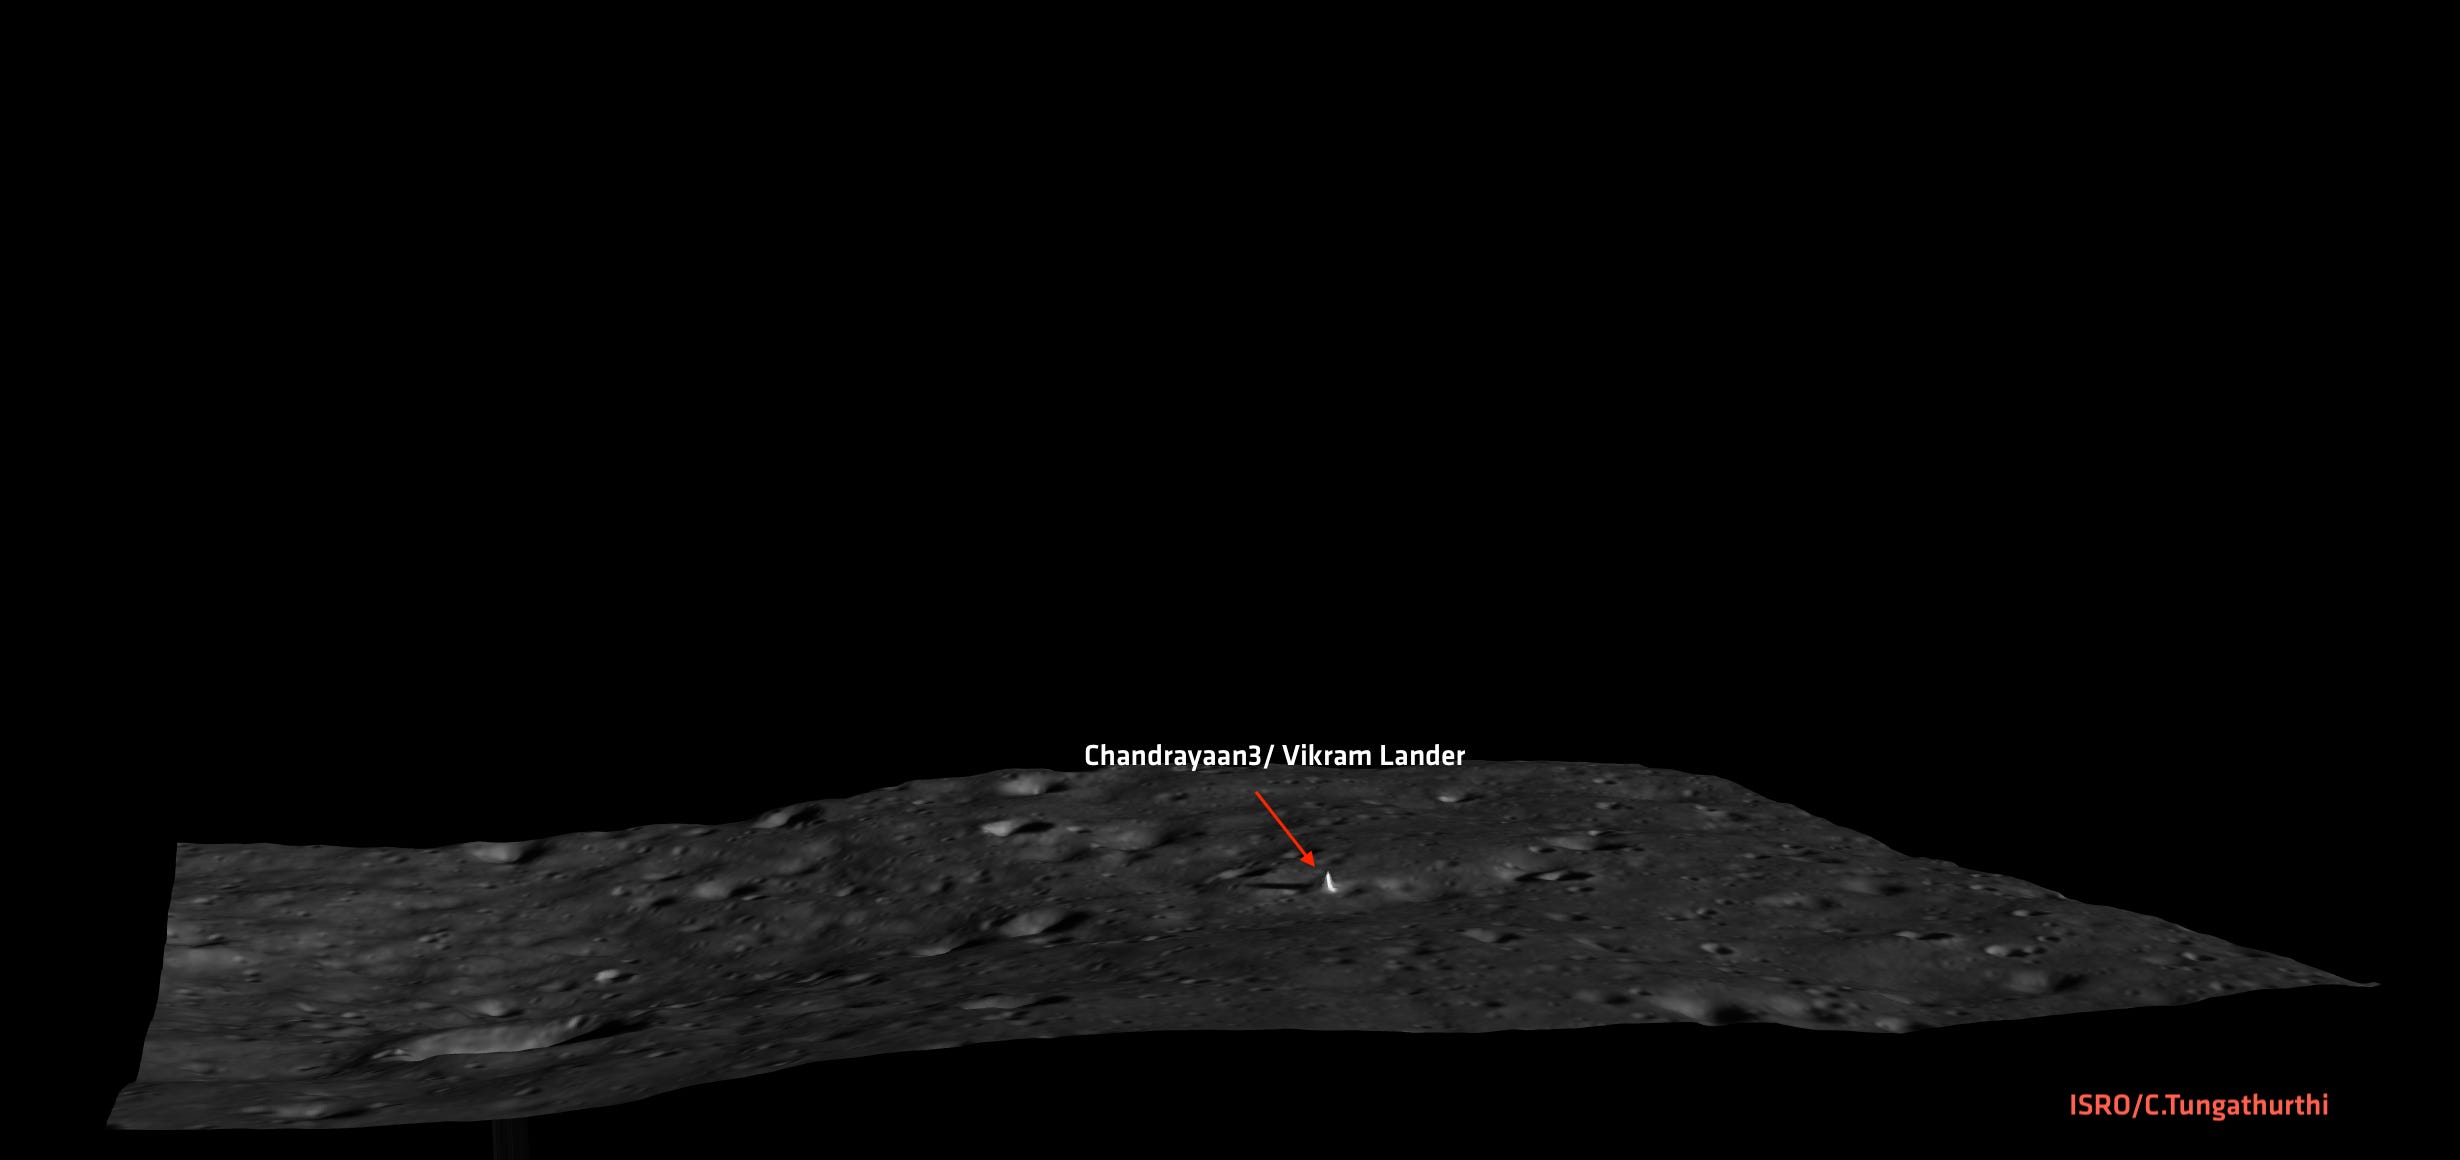
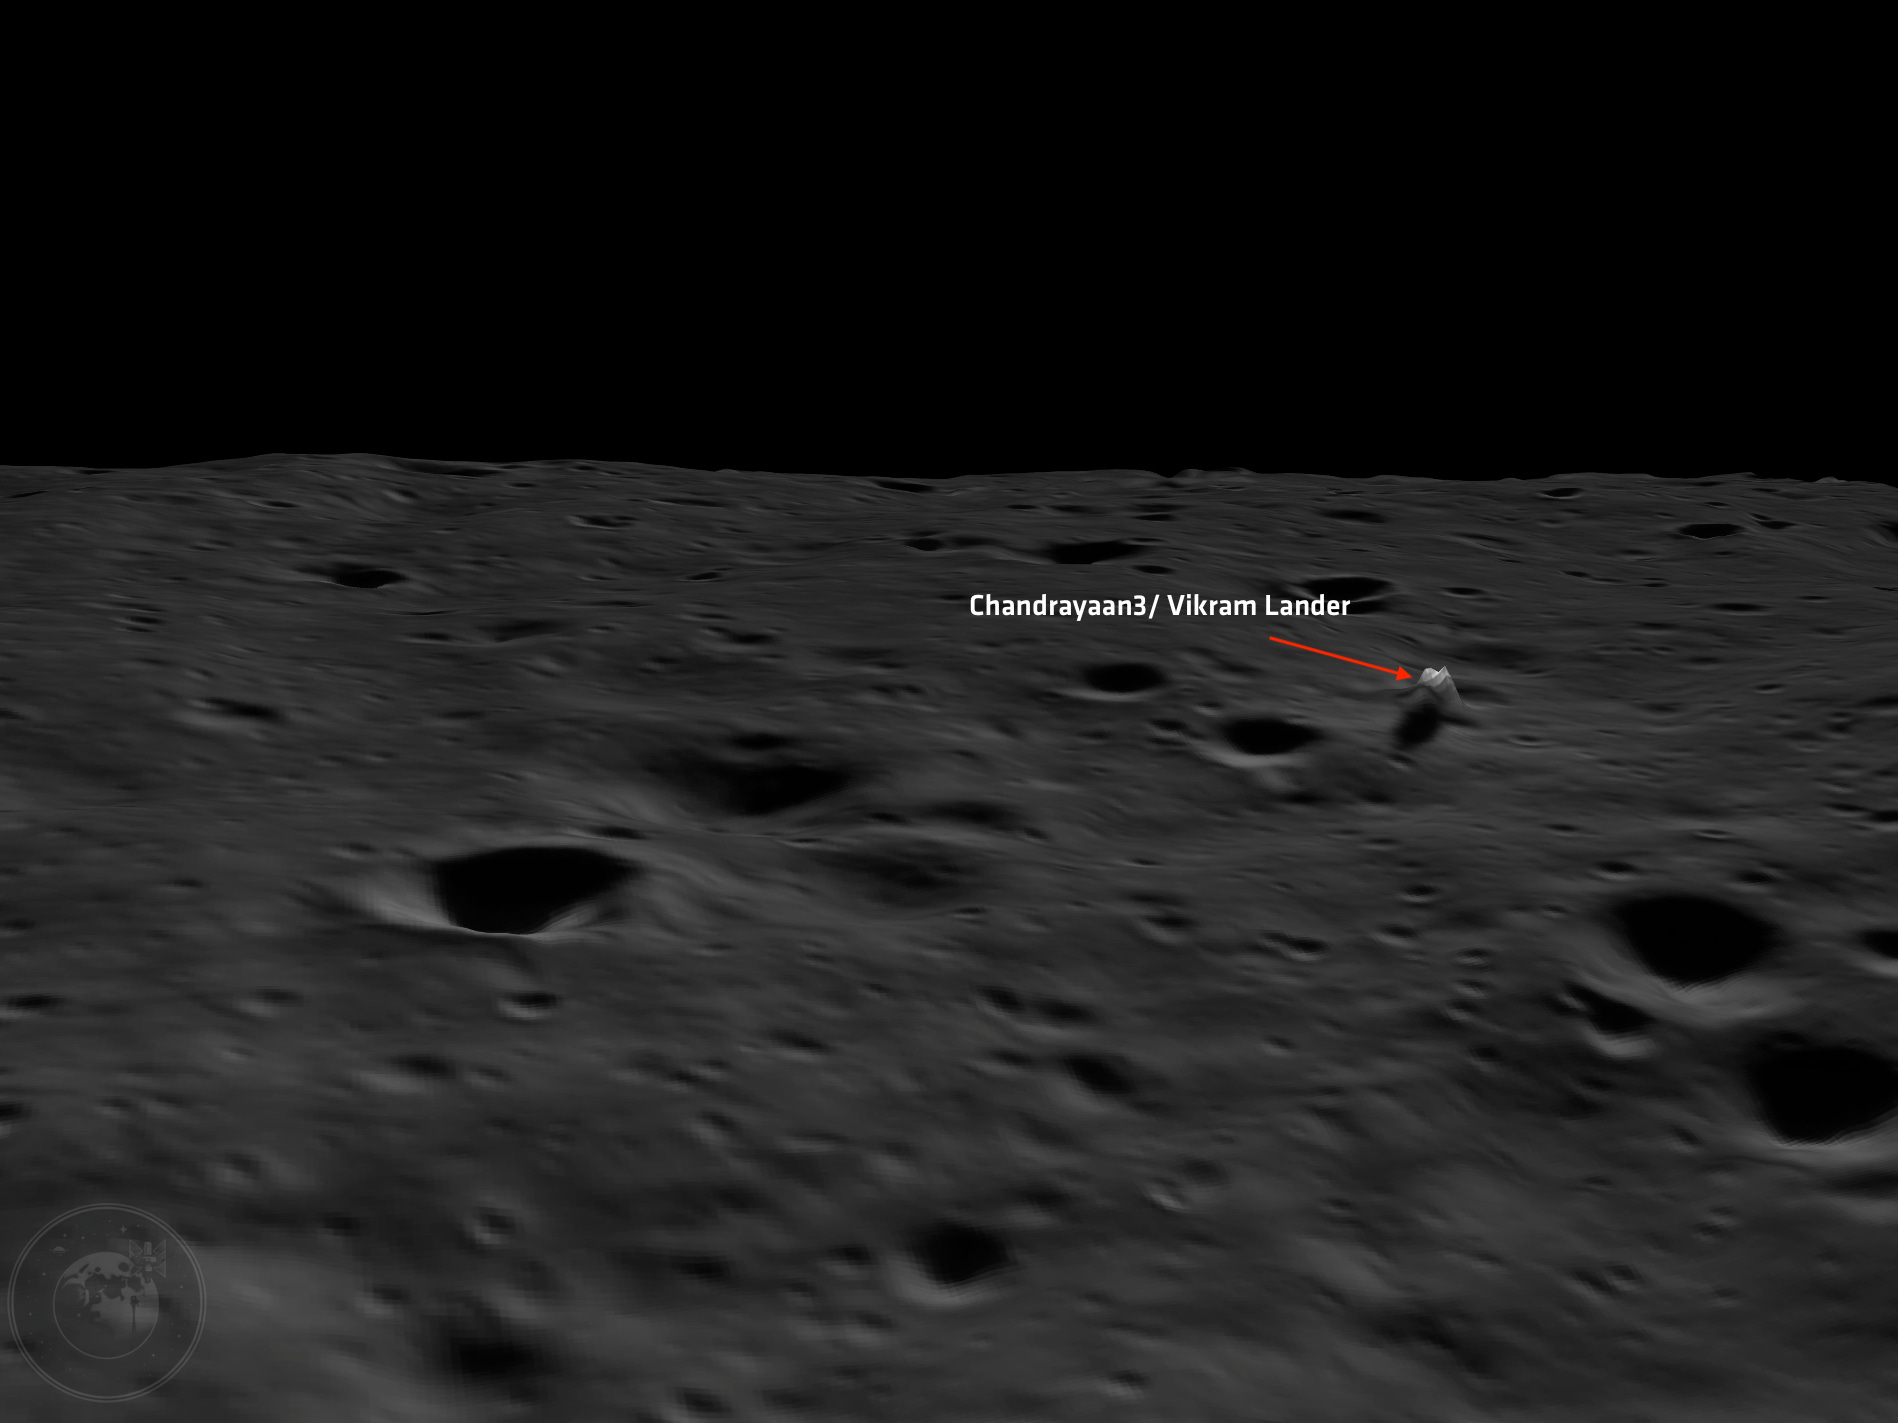
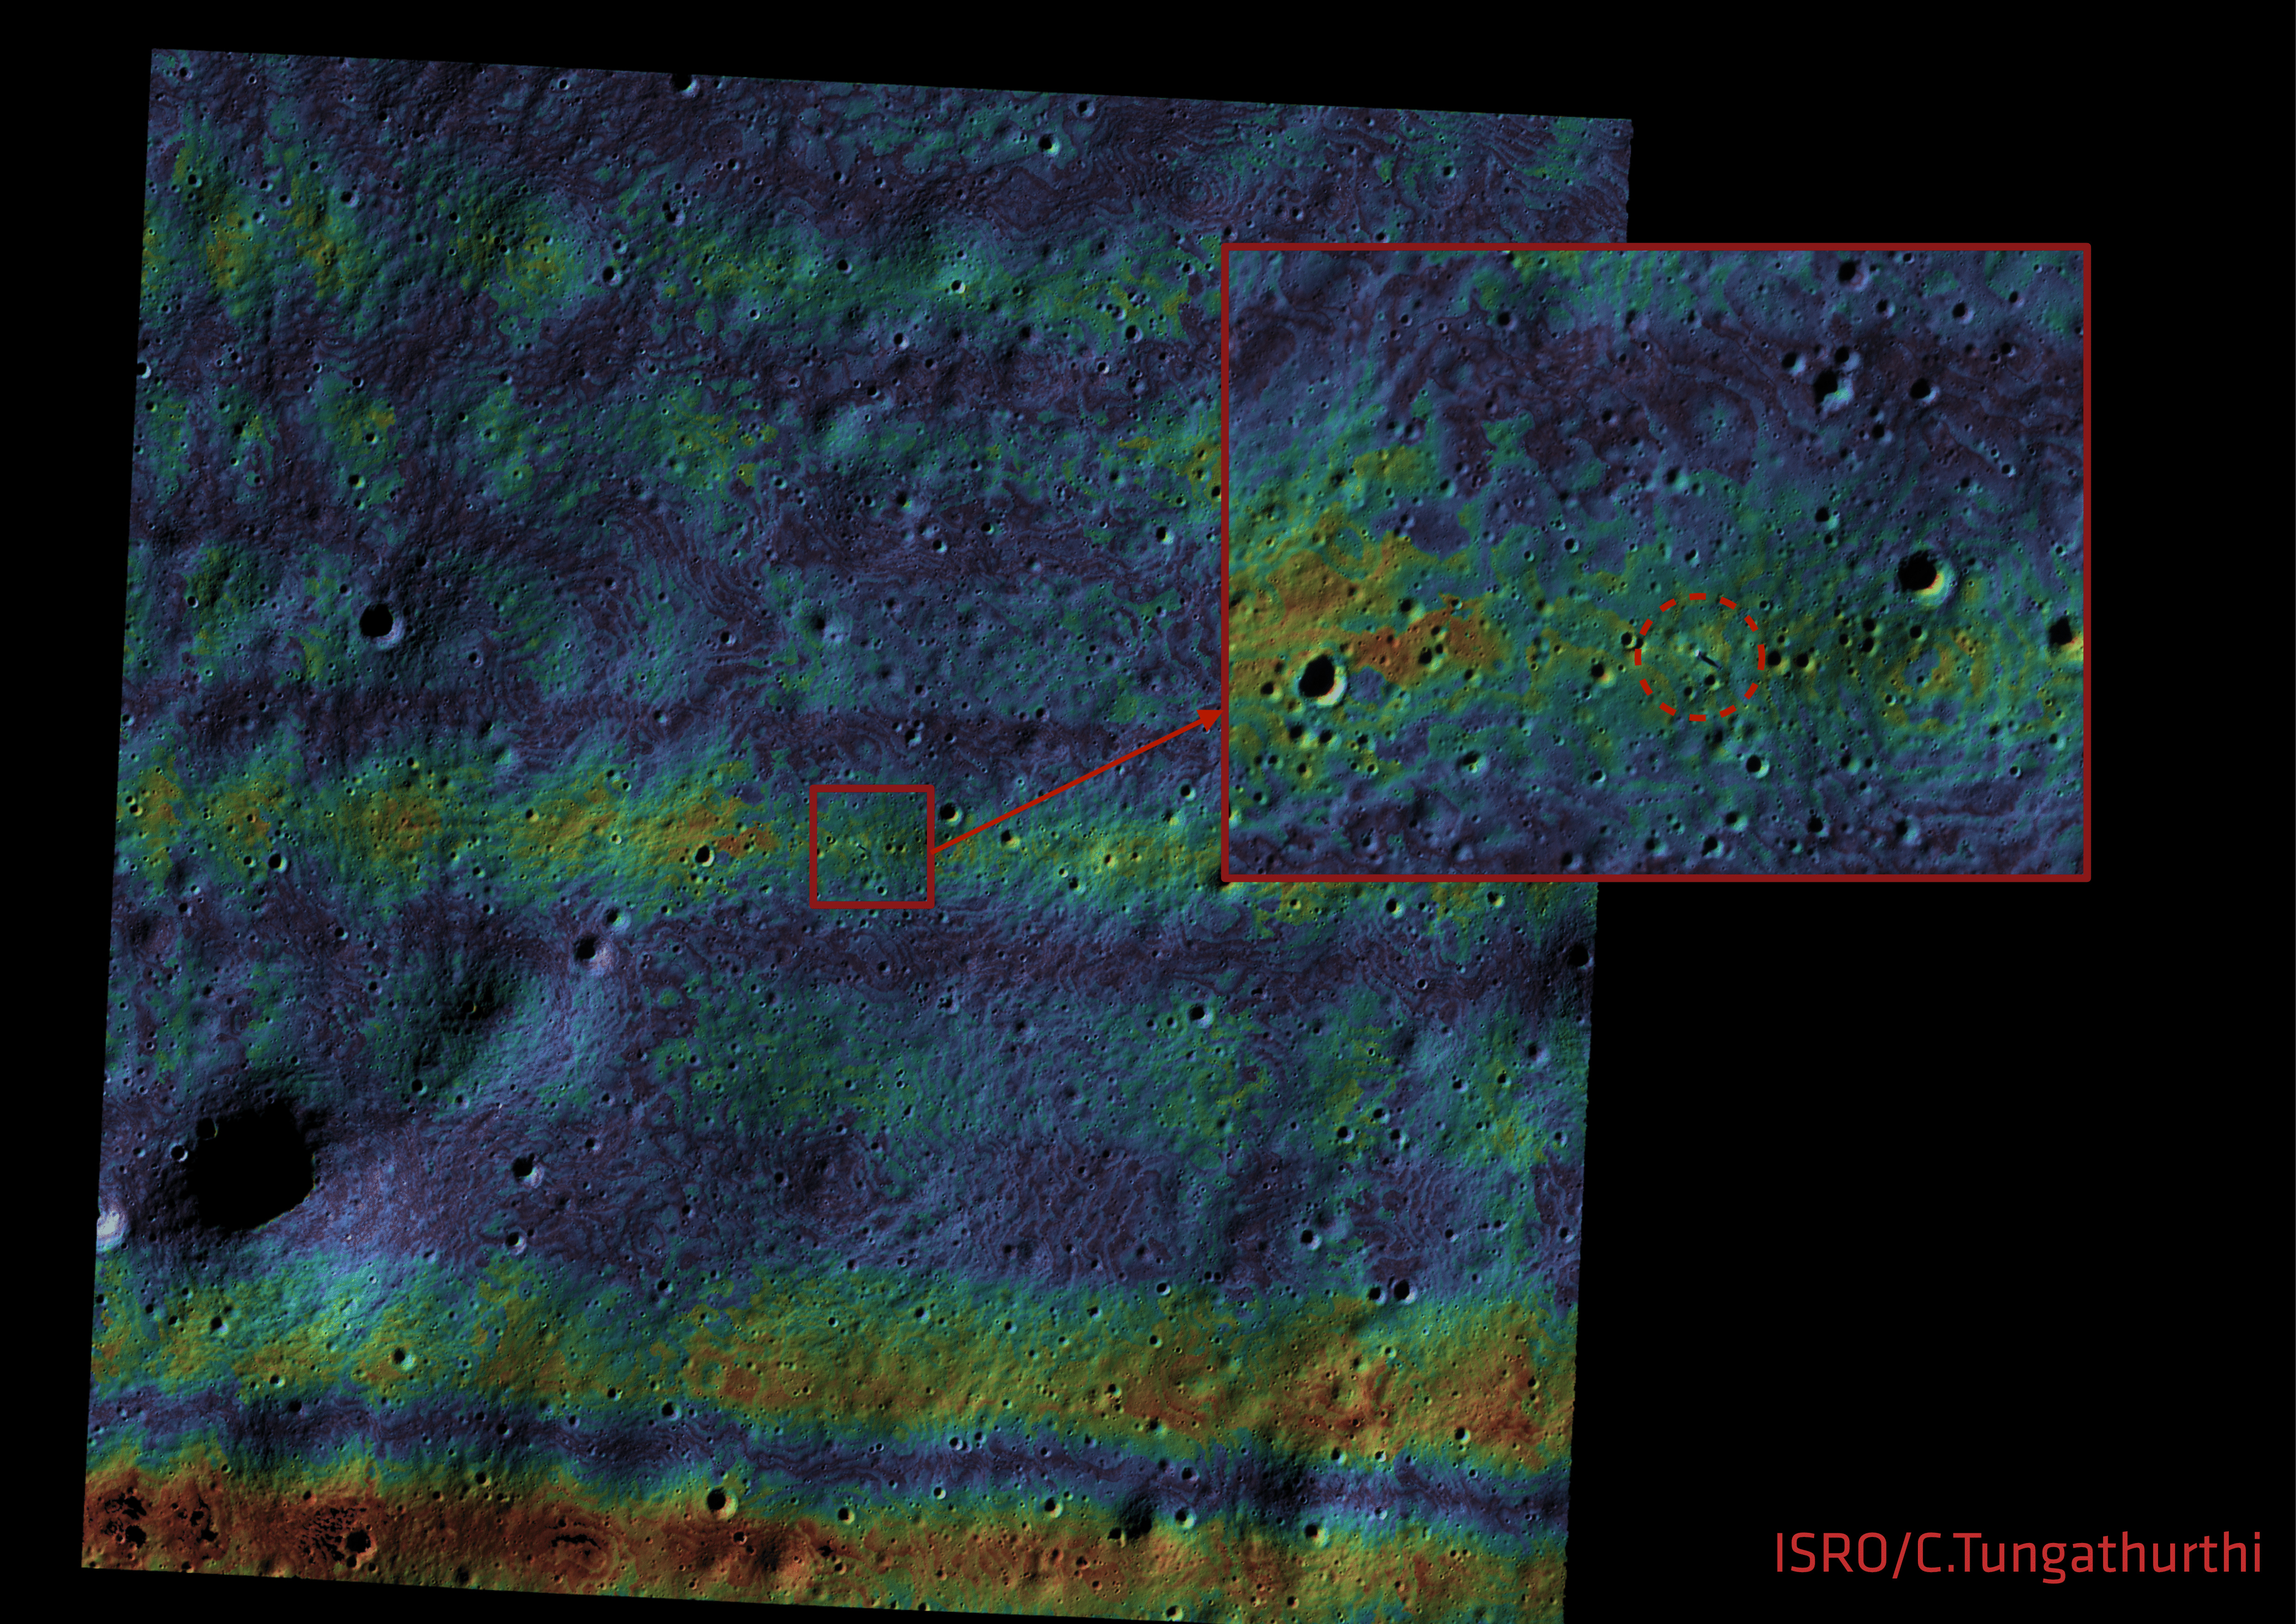
For this first release, I targeted the Shiv Shakti Point region — the area around Chandrayaan-3’s Vikram landing site.
In total, I ended up downloading the entire catalogue of OHRC positional data and imagery. Over 120 GiB of data. My internet connection was not happy about it.
The Processing Pipeline: Step by Step
Here is the complete pipeline I followed to go from raw OHRC data to a finished elevation map. I’ll walk through each stage — what it does, where things broke, and how I got around it.
I should note upfront: this pipeline is still evolving. The tools themselves are under active development, and some of my workarounds may become unnecessary as upstream fixes land. There may be minor inaccuracies in the results — I’m still validating against reference data where it exists. What I’m sharing here is what worked for me, as of now, to produce what I believe are credible results. I’ll update this as I learn more.
Fair warning: if you’ve stuck with me this far, thank you. In the sections below I walk through each step of the pipeline in some detail — what it does, where things broke, and how I got around it. If the nitty-gritty isn’t your thing, feel free to skip ahead to the results.
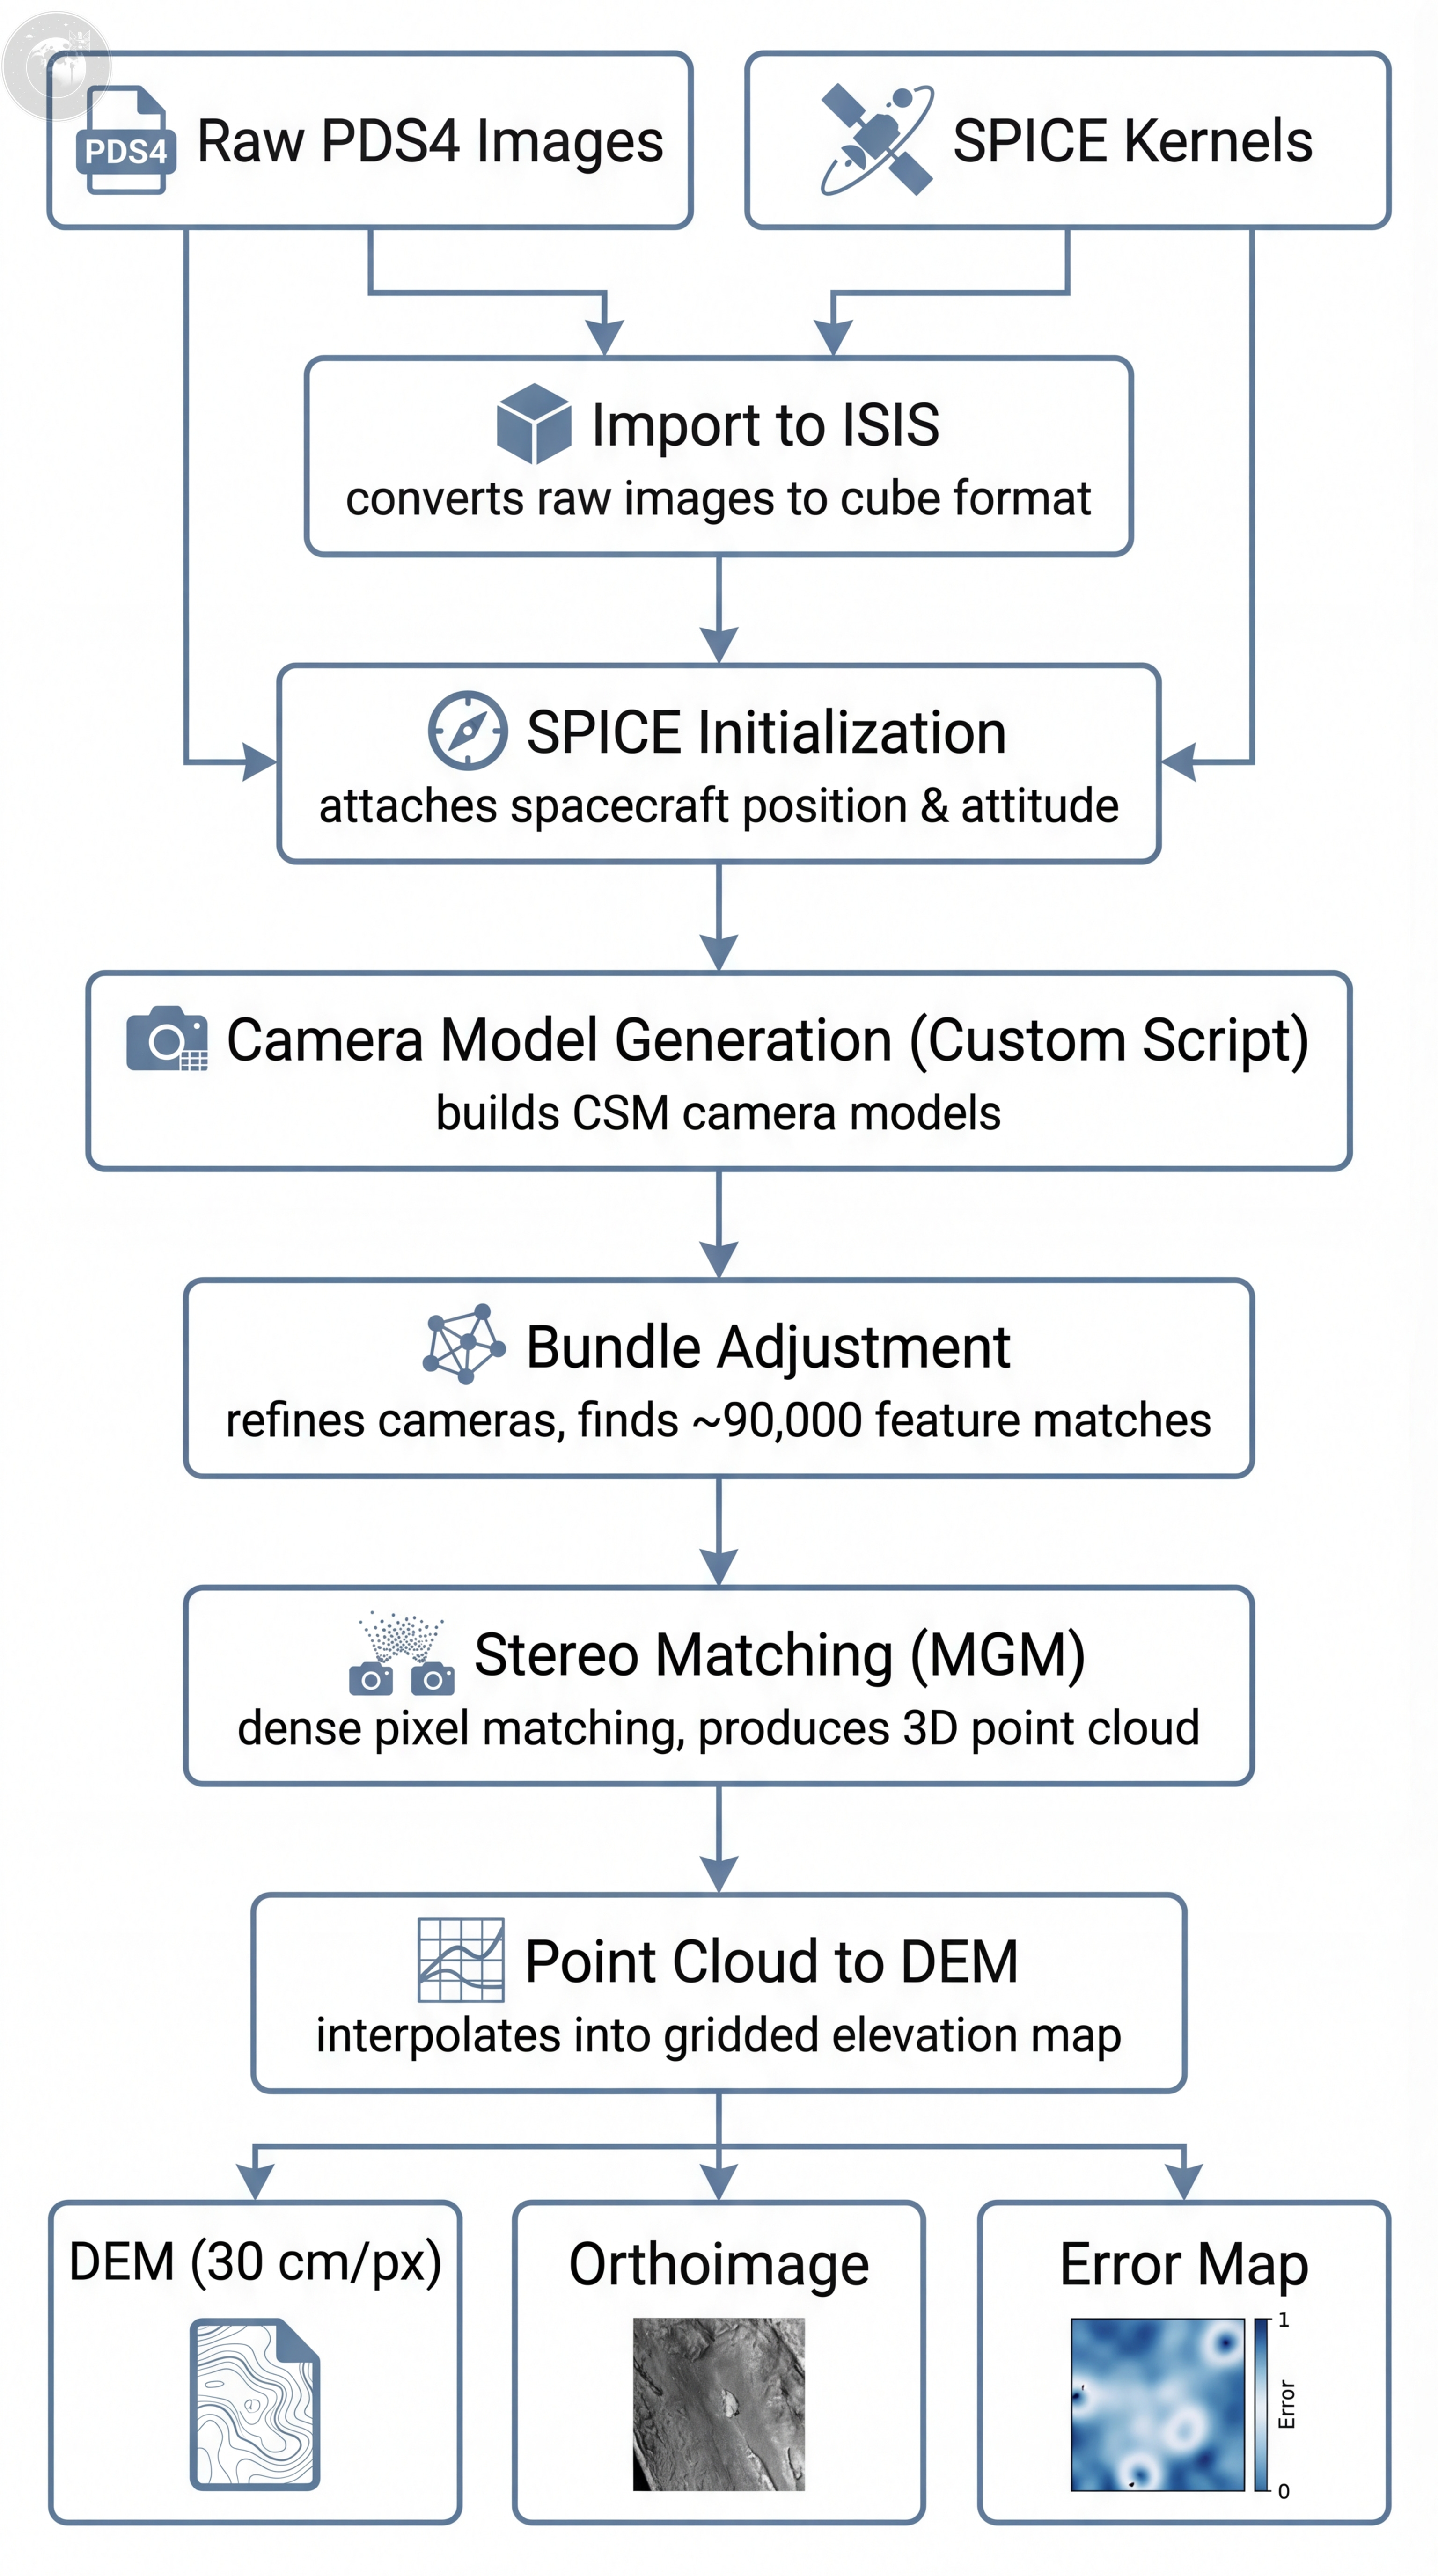
Step 1: Ingestion and SPICE Initialization
The first step converts OHRC’s archival PDS4 images into ISIS cube format, then attaches SPICE kernels. The SPICE system — originally developed by NASA’s NAIF — is what tells the software where the spacecraft was, how it was oriented, and where each detector pixel was pointing at the moment of capture. Without it, the image is just a grid of numbers with no spatial meaning.
This is where I hit my first wall.
The SPICE initialization step told me it couldn’t find attitude kernels covering my image dates. The images I was processing were from April 2024 — part of the recent polar imaging campaign I wrote about in my OHRC key insights analysis. The kernel files existed on PRADAN, but ISIS didn’t know about them because its internal kernel database hadn’t been updated.
So I downloaded the specific kernel files, placed them in the right directory, and ran the database regeneration tool. Sounds simple, right? It took me an entire day. The database tool has very specific expectations about how file paths are formatted internally — and if you get the format wrong, the lookup just silently fails. No error, no warning. It just doesn’t find the kernel. I tried everything before stumbling onto the correct path format buried in an ISIS developer discussion thread. One of those problems where the fix is a single line but finding it takes eight hours.
Step 2: Camera Model Generation — The Part I Had to Build Myself
This is where things get interesting, and where the pipeline diverges from what you’d see with a NASA mission.
For most missions ISIS supports — LRO, MRO, Cassini — generating camera models is a one-command affair. For Chandrayaan-2 OHRC, it just... doesn’t work out of the box. I spent a long time trying to figure out why.
The root issue is that the OHRC camera driver in ALE (the library that generates camera models) wasn’t included in the released version at all. It only existed on the development branch of the GitHub repository. So step one was installing ALE from source — already off the beaten path. But even after that, the standard camera model generation command failed because the driver expects spacecraft navigation data to be pre-loaded into memory, and the standard command doesn’t know how to find or load Chandrayaan-2’s data files automatically. For NASA missions, these paths are pre-configured. For Chandrayaan-2, they’re not.
I ended up writing a custom Python script that bridges this gap. It reads the navigation data file paths that ISIS recorded during the previous step, loads them into memory manually, and then invokes ALE’s Chandrayaan-2 driver directly to produce the camera model files that ASP needs downstream. It’s not elegant, but it works. And without it, the pipeline stops dead at this step.
There’s also an open pull request on ALE’s repository that includes geometric corrections for the OHRC driver. When that gets merged, the camera models should improve further. That’s the thing I love about open-source: I can see exactly what’s being fixed, contribute back, and everyone benefits.
Step 3: Bundle Adjustment — Where Everything Changed
Bundle adjustment refines camera positions by finding matching features across the stereo pair and minimizing the geometric error. ASP handles this automatically.
But this step produced the single most dramatic discovery in the entire project. And it came down to something that is absolutely not obvious from the documentation: which type of camera model you use changes everything.
There are two different camera model approaches in the ecosystem. The older ISIS-style model computes viewing geometry line by line. The newer Community Sensor Model (CSM) uses a continuous, interpolated representation. Both describe the same physical camera. In theory, they should give similar results.
In practice, the difference was staggering:
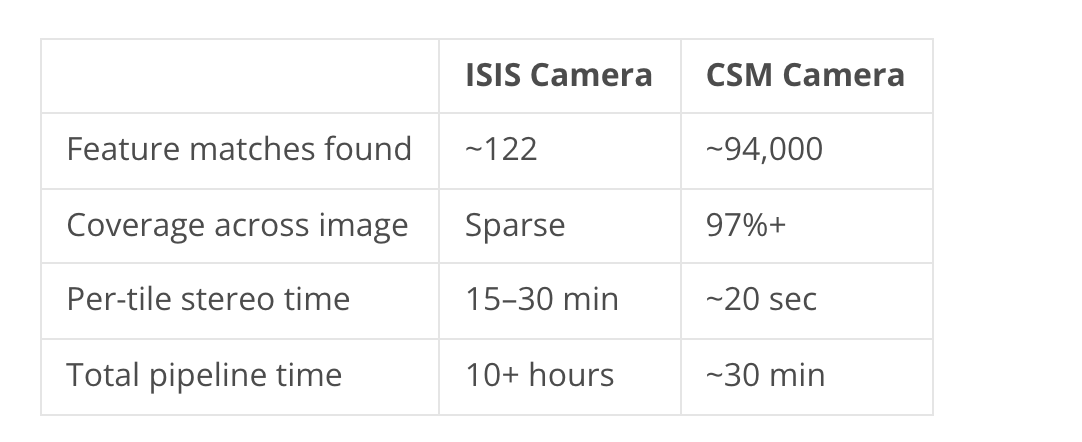
I sat there staring at the bundle adjustment log the first time CSM cameras produced 94,000 matches. I had been struggling for weeks with the ISIS camera path, getting ~100 matches, watching stereo tiles grind for 20 minutes each, wondering if something was fundamentally wrong with the data. Switching to CSM cameras — the ones generated by my custom script from Step 2 — turned a half-day ordeal into a 30-minute job.
This isn’t an incremental improvement. It’s nearly a thousand times more matches, and a 20-50x speedup in total processing time. It’s the difference between something that’s barely feasible and something you can run routinely.
I want to stress: both camera models come from the same open-source ecosystem. The CSM path just wasn’t the default for Chandrayaan-2, and getting it to work required the custom script. This is the kind of hard-won practical knowledge that only comes from actually running the full pipeline — and exactly the kind of thing I want to share so the next person doesn’t have to rediscover it the hard way.
Step 4: Stereo Matching
With the refined CSM cameras, the stereo matching step computes a dense pixel-by-pixel correspondence between the two images using the MGM (More Global Matching) algorithm — well-suited to pushbroom line scanners like OHRC. The software divides the overlap into tiles, processes them in parallel across CPU cores, then stitches and blends the results. From the matches, it triangulates each pixel pair into a 3D point in lunar coordinates.
This step mostly just ran. But “mostly” is doing some heavy lifting.
There was a naming inconsistency in ASP where the MGM algorithm produced output files with one name but the blending step expected a different name. A known bug — the workaround is creating file links for every processing tile. Annoying, but scriptable.
The bigger headache was that if even one tile out of hundreds fails or times out, the job scheduler kills the entire run. On a processing job that takes hours, that’s brutal. I learned to set generous timeout values, and more importantly, learned how to resume from the last completed stage rather than starting over. I lost a few runs before figuring that out.
Step 5: DEM Generation
The final computational step interpolates the irregular 3D point cloud into a regular gridded elevation map.
One thing I learned the hard way: let the tool choose the grid resolution automatically. My first instinct was to force 25 cm spacing to match OHRC’s native pixel size. But the tool correctly warned me that the point cloud wasn’t dense enough to support that — the actual information content after stereo matching and triangulation supports about 30-35 cm. Forcing a finer grid just interpolates between points and gives you a false sense of resolution. I appreciated the honesty.
The output is three products:
DEM — elevation values in meters relative to the lunar reference ellipsoid
Orthoimage — the image draped onto the DEM surface, removing terrain distortion
Error map — per-pixel triangulation error, showing where the 3D reconstruction is most and least reliable
Step 6: Visualization & Normalization
One last surprise that tripped me up: lunar elevation values are all large negative numbers. The surface typically sits 1-2 km below the reference ellipsoid (which has a radius of 1737.4 km), so a typical DEM might range from -1750 m to -1565 m. Most 3D viewers and even some GIS tools completely choke on this. The fix is simple — shift values into a positive range for visualization.
The Uncool Stuff That Wasted the Most Time
I’d be dishonest if I didn’t mention the platform-level issues that had nothing to do with planetary science but consumed days of debugging:
Running this on an Apple Silicon Mac meant dealing with the fact that ISIS operates under processor emulation while some of its dependencies get installed as native packages. When they don’t match, things crash with cryptic library loading errors. Figuring out that this was an architecture mismatch — and not a corrupted installation — took me longer than I’d like to admit.
Then there was the fact that ASP installs its own set of system tools that can silently override the ones from the Python environment. Every script invocation broke until I figured out the PATH ordering was wrong. Not a science problem. Not even really a software problem. Just... computers being computers.
These things don’t show up in papers. But they’re a real part of making any of this work, and they’ll absolutely stop someone trying to reproduce the results if they’re not warned.
The Result


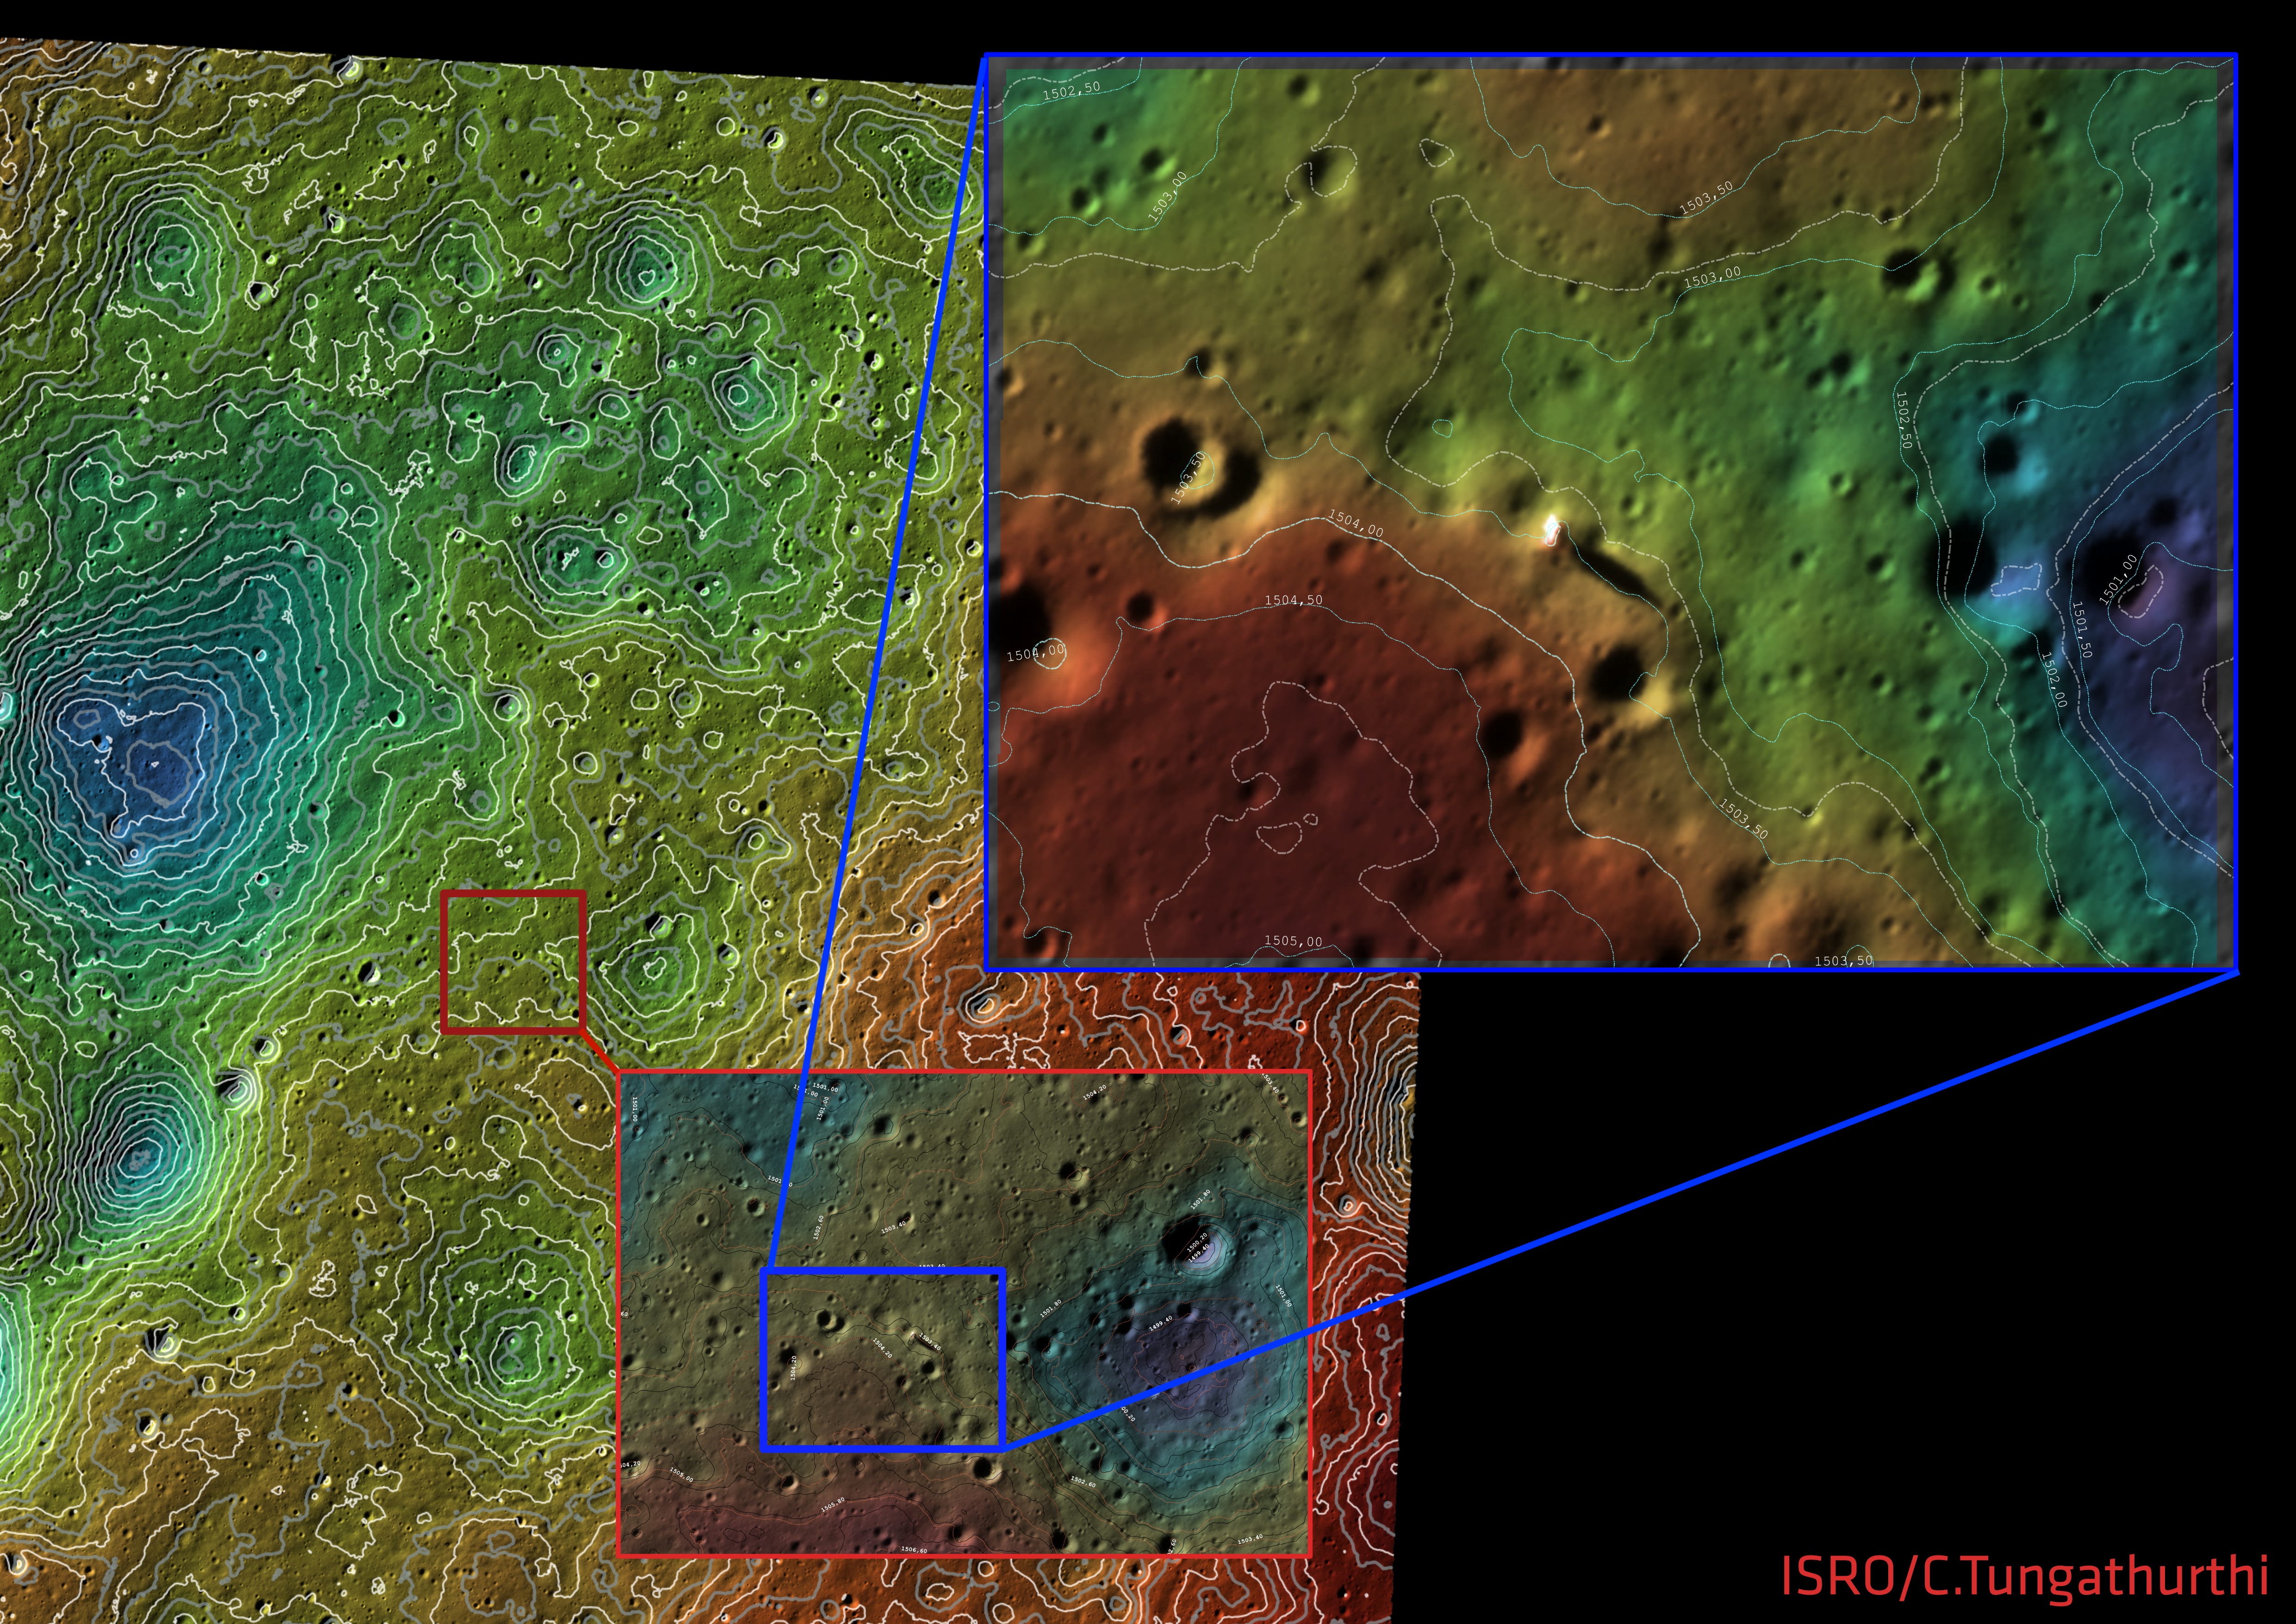
After months of understanding the data, weeks of building and debugging the pipeline, and over 24 hours of final processing on a high-performance machine, the output is a Digital Elevation Model of the Shiv Shakti Point region at approximately 30 cm per pixel.
Metric Value Horizontal resolution ~0.30 m (30 cm per pixel) Vertical accuracy ~40–50 cm Median triangulation error 8 cm Coverage 2.18 x 2.24 km Valid pixels 91.6%
For context: the best publicly available lunar elevation data from NASA’s LRO LOLA achieves roughly 1 meter at selected sites, and about 30 meters globally. This OHRC-derived DEM is roughly 3x finer than LOLA’s best, and over 100x finer than global coverage.
At this resolution, you can see individual boulders. Meter-scale terrain features — subtle slopes, small craters, regolith texture — become clearly visible in the elevation data.
This is, to my knowledge, among the highest resolution open elevation datasets produced from Indian lunar mission data. And it was built entirely from publicly available Chandrayaan-2 imagery, using open-source tools, by one person.
Lastly, I want to be transparent here: the pipeline is still being refined, and there may be minor inaccuracies as I continue to validate against reference datasets. The numbers above represent my best current results. As the upstream tools improve — particularly the geometric corrections in ALE — I expect the accuracy to improve as well.
Why This Matters for What Comes Next
India’s Chandrayaan-4 mission aims to demonstrate lunar regolith sample collection and return. That’s an extraordinarily demanding task — not just the propulsion and robotics, but the site selection. You need to know not just where the flat spots are, but how flat they actually are. Whether there’s a 30 cm boulder hiding in what looks smooth at coarser resolution. Whether the local slope exceeds the lander’s tilt tolerance. Whether the terrain between the lander and the sample site is actually traversable.
A 30-meter elevation model can’t answer those questions. A 1-meter model gets close. A 30-centimeter model can.
As I discussed in my analysis of the IM-2 Athena landing, high-resolution data plays a dual role: pre-landing site characterization and post-landing forensic reconstruction when things don’t go as planned. The scuff marks, the drag patterns, the tilt of a toppled lander — all of these become analyzable when you have both imagery and elevation data at sub-meter resolution.
The raw data for more of these maps already exists. Chandrayaan-2’s OHRC has been capturing stereo pairs across the lunar surface for over five years now. The polar imaging campaign of early 2024 — which I documented in my OHRC operational insights — produced dozens of observations near the south pole in preparation for LUPEX. The imagery is there. The navigation data is there. The tools are there.
What’s Next
This first release covers a single site. The OHRC archive contains stereo pairs across multiple locations — polar regions, mid-latitude sites, areas of geological interest. I plan to process additional sites wherever viable stereo coverage exists and make the resulting elevation products available to the wider community. Soma — the lunar data portal I’ve been building — will be the primary way to access and explore these products once I release it.
I also plan to contribute back to the open-source tools that made this possible. The custom scripts, the workflow documentation, the workarounds — all of it should flow upstream so the next person doesn’t start from zero. There’s already an open pull request improving the OHRC camera model, and I’d like to help get that across the finish line.
The open-source planetary science community — at USGS Astrogeology, NASA Ames, and the universities contributing to ISIS, ASP, and ALE — has built something genuinely remarkable: a toolkit that lets anyone with enough persistence produce science-grade data products from planetary mission data. That philosophy of openness is what made this work possible. I hope ISRO, in time, comes to embrace a similar approach — not just releasing raw data, but investing in open tools and open data products that let the global community build on India’s remarkable achievements in space. India built the best camera at the Moon. Let’s make sure the world can use what it sees.
The elevation maps discussed in this post were built using Chandrayaan-2 OHRC data from ISRO’s PRADAN portal, processed with ISIS (USGS), the Ames Stereo Pipeline (NASA), and ALE (USGS). This is an evolving effort — results will be updated as the tools and validation improve.
References:
[1] Chowdhury, Arup Roy, et al. “Orbiter High Resolution Camera onboard Chandrayaan-2 Orbiter.” Current Science, vol. 118, no. 4, 2020, pp. 560-565.
[2] Amitabh, Ashutosh Gupta, K. Suresh, et al. “High Resolution DEM Generation from Chandrayaan-2 Orbiter High Resolution Camera Images.” LPSC 2021.
[3] Amitabh, K. Suresh, et al. “Terrain Characterization of Potential Landing Sites for Chandrayaan-3 Lander using Orbiter High Resolution Camera (OHRC) Images.”
[4] Beyer, R. A., Alexandrov, O., and McMichael, S. “The Ames Stereo Pipeline: NASA’s Open Source Software for Deriving and Processing Terrain Data.” Earth and Space Science, 5, 2018.
~FIN
Mr Tungathurthi, I have to say this one of the best posts I have come across in the recent past. Its not just about creating a stereo image of the landing site with the highest resolution yet, but doing that whilst providing such a detailed explanation is just remarkable. Is it possible for you to provide a scale for the DEM maps, that would be wonderful. I also wonder how you rendered the final orthoimage.