Seeing in unprecedented detail: Key Operational insights into Chandrayaan 2 Orbital High-resolution Camera
The metadata analysis of the Chandrayaan 2 OHRC highlights significant operational trends, such as changes in the orbiter's altitude resulting in setting new benchmarks
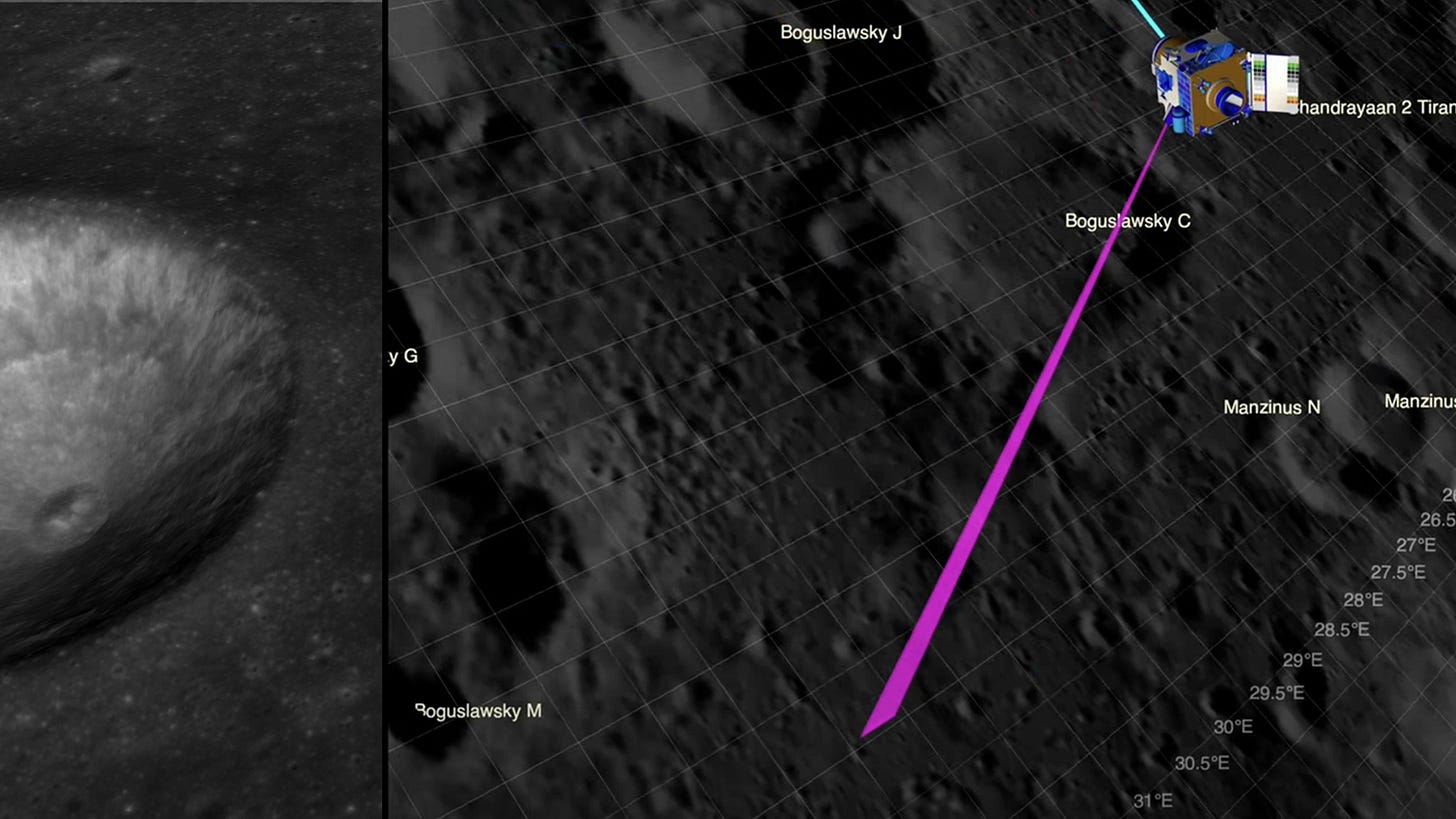
In my previous blog posts, I have demonstrated that Chandrayaan 2 operates beyond the commonly advertised 25cm resolution of images. The image capturing Vikram and Pragyan was at a 17cm resolution, and the SLIM was captured at an even finer resolution of 16cm. This level of detail is not widely known, as the 25cm resolution at 100km altitude is considered standard, making its capability to capture images at higher and finer resolutions rather obscure.
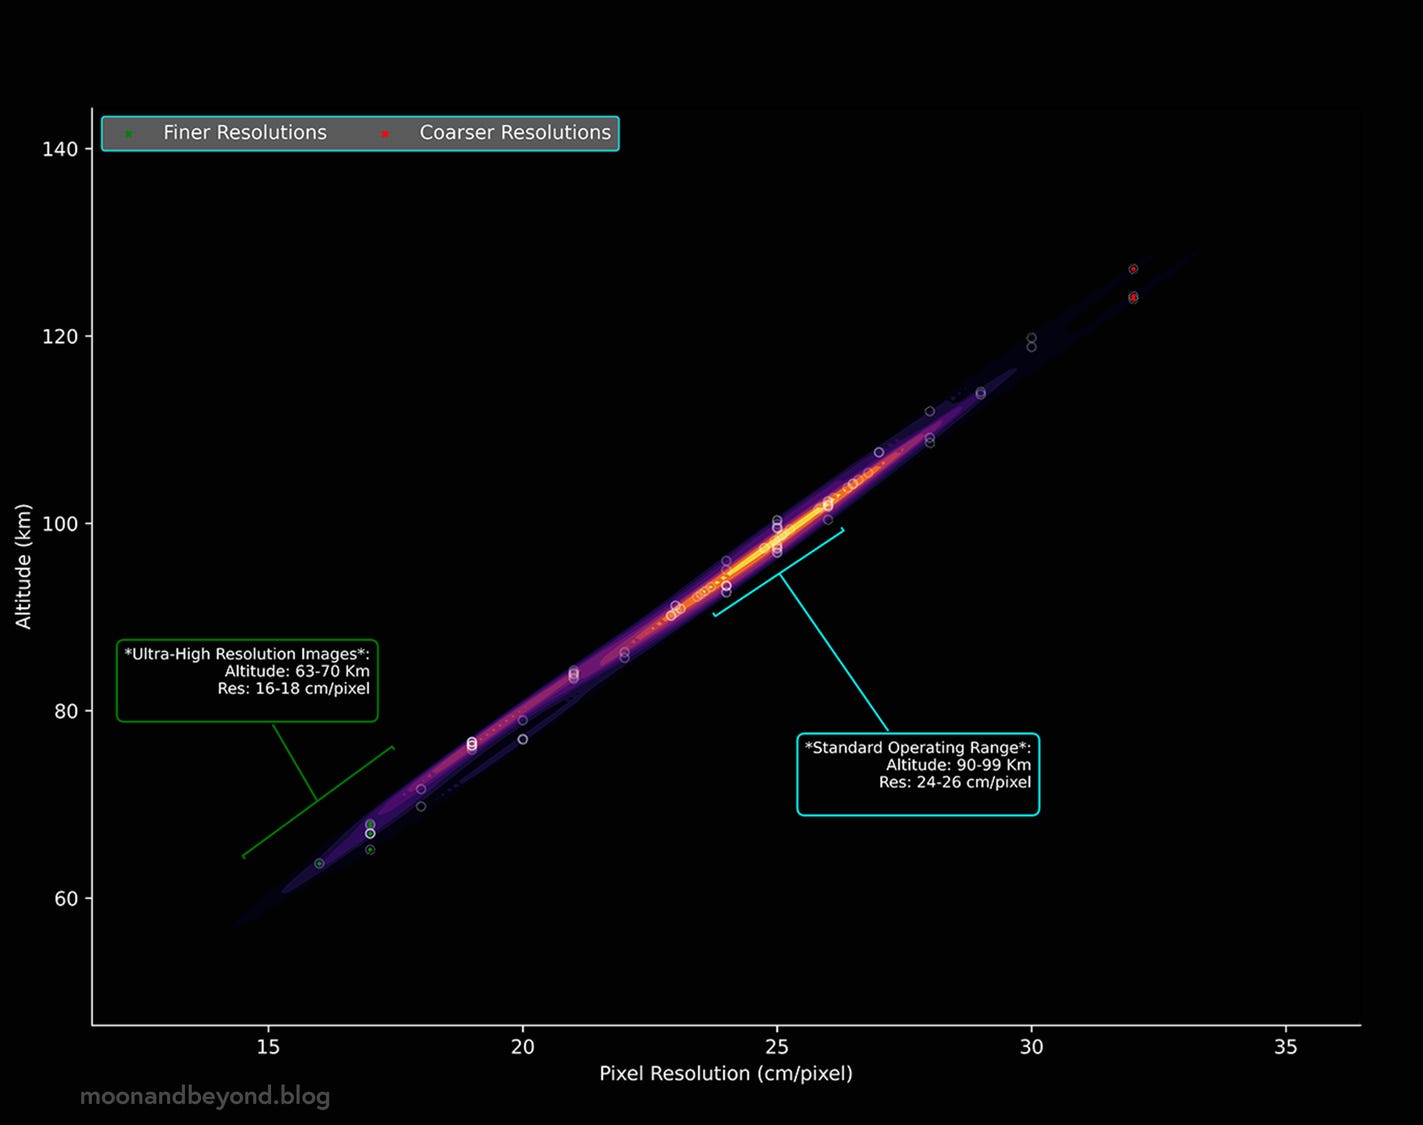
Over the past weeks, I've developed various techniques as part of my workflow to study all the published images captured by the Orbiter High-Resolution Camera (OHRC). Although all PDS4 (Planetary Data System version 4) data products come with a separate metadata file, you don't need to download the data to understand the conditions under which the image was taken. The PRADAN portal, though somewhat dated, allows users to view metadata without needing to download the data.
I've analyzed all the metadata of the data cataloged by OHRC that is available in the public domain. From this analysis, we can derive key insights into how OHRC is operated by ISRO and potentially glimpse its future capabilities.
But first, let’s understand what OHRC brings to the table and why it is ISRO's most important instrument for future missions –
The Moon's Highest Resolution Camera
The OHRC's optical system uses a Ritchey–Chrétien design, which is excellent at reducing image distortion due to its field-correcting optics (FCO). This design is also chosen for ShadowCam, which aims to image the PSRs in low-illumination conditions with different performance specifications compared to OHRC. The optical system of OHRC uses a 12,000 pixels Time Delay Integration (TDI) CCD detector. In contrast, ShadowCam uses a more sensitive TDI CCD designed to capture faint light in permanently shadowed regions.
The OHRC employs a primary mirror with a diameter of 300 mm and an effective focal length of 2046 mm, which allows it to achieve a narrow field of view (FOV) of ±0.86°. This setup enables OHRC to capture high-resolution images with a ground sampling distance (GSD) of 0.25 meters per pixel, providing a swath of 3 km at nadir at a nominal altitude of 100Km. This high resolution and wide swath enable OHRC to perform detailed surface characterisation and hazard detection with high precision [1].
OHRC’s optical configuration is designed to maintain high image quality. It includes measurements to ensure the sharpness and contrast of the images. The system keeps a modulation transfer function (MTF) of 24% at the highest spatial frequency it can detect, which helps in capturing images with fine details clearly.
What Makes OHRC Special and Suitable for Current and Future Lunar Missions
High Spatial Resolution: At an optimal range of 90-95 km, the OHRC (Orbiter High-Resolution Camera) provides incredibly detailed images with a Ground Sampling Distance (GSD) of 24-26 cm per pixel. This high resolution is crucial for identifying small-scale surface features and potential hazards. Such detailed imaging is essential for mission planning, particularly when selecting safe landing sites and navigating the lunar surface.
Ultra-High Resolution Stereo Imaging Capability: OHRC can capture multi-view stereo images within a single orbit through different spacecraft orientations, allowing the creation of digital elevation models (DEMs) with equally high spatial resolution. These models are vital for understanding lunar topography and identifying potential hazards such as slopes, boulders, and craters. The Space Applications Centre (SAC) uses a purpose-built indigenous software called OPTIMUS to generate these DEM files. The resulting DEM-Ortho pair offers approximately 28 cm horizontal and 100 cm vertical resolution [3], ensuring detailed topographical data useful for creating landing Hazard Maps [4].
Adaptability to Illumination Conditions: OHRC's Time Delay Integration (TDI) Charge-Coupled Device (CCD) detector is optimized for low illumination conditions, such as those found during early lunar day cycles. This adaptability ensures that high-quality images can be captured even when the sun's elevation is low, maximising the operational time for the lander and rover instruments.
In comparison, ShadowCam has a slightly wider field of view (FOV) of approximately 2.86° and is designed to operate efficiently in extremely low light, with a spatial resolution of 1.7 meters per pixel from a similar altitude. ShadowCam's optical system includes enhanced baffling and a redesigned focal plane to reduce stray light, making it 200 times more sensitive than the Lunar Reconnaissance Orbiter Camera (LROC) Narrow Angle Camera (NAC). This enhanced sensitivity makes it five times more efficient in rejecting stray light. This specialized design, combined with its high sensitivity, makes ShadowCam highly effective for its primary mission of mapping and studying the lunar polar regions under low illumination conditions [2].
Both systems utilize their optical design to achieve their respective goals. OHRC focuses on high-resolution imaging for landing site characterization and terrain analysis, while ShadowCam specializes in imaging the dimly lit permanently shadowed regions to study lunar volatiles and polar environments. However, the specific features of OHRC, such as its high spatial resolution, stereo imaging capability, and adaptability to various illumination conditions, make it particularly well-suited for mission planning and safe landing site identification, which are critical for the success of lunar exploration missions.
Key Operational Insights
Since its inception in 2019, Chandrayaan 2 has made significant contributions to Indian lunar exploration. As of May 26, 2024, it has disseminated a total of 208 images, of which 104 are calibrated, amounting to approximately 229.73 GB of data, with each image averaging around 1.1 GB. It is my belief, however, that not all images captured by the OHRC have been released. Specifically, ISRO has denied access to the images that show the crash debris of the Vikram lander.
Navigating Operational Phases: Pushing the Limits to Define New Norms
The analysis of Chandrayaan 2's altitude data reveals distinct phases and significant trends throughout the mission. The initial stabilization phase (2019 - early 2020) shows consistent altitudes with minimal fluctuations, indicating a focus on establishing regular operations and calibrations. This is followed by the first adjustment phase (mid-2020 - early 2021), where significant altitude fluctuations suggest active orbit adjustments and maintenance activities. The operational stability phase (mid-2021 - late 2022) is characterized by stable altitudes and consistent image capture, reflecting routine and efficient mission operations.
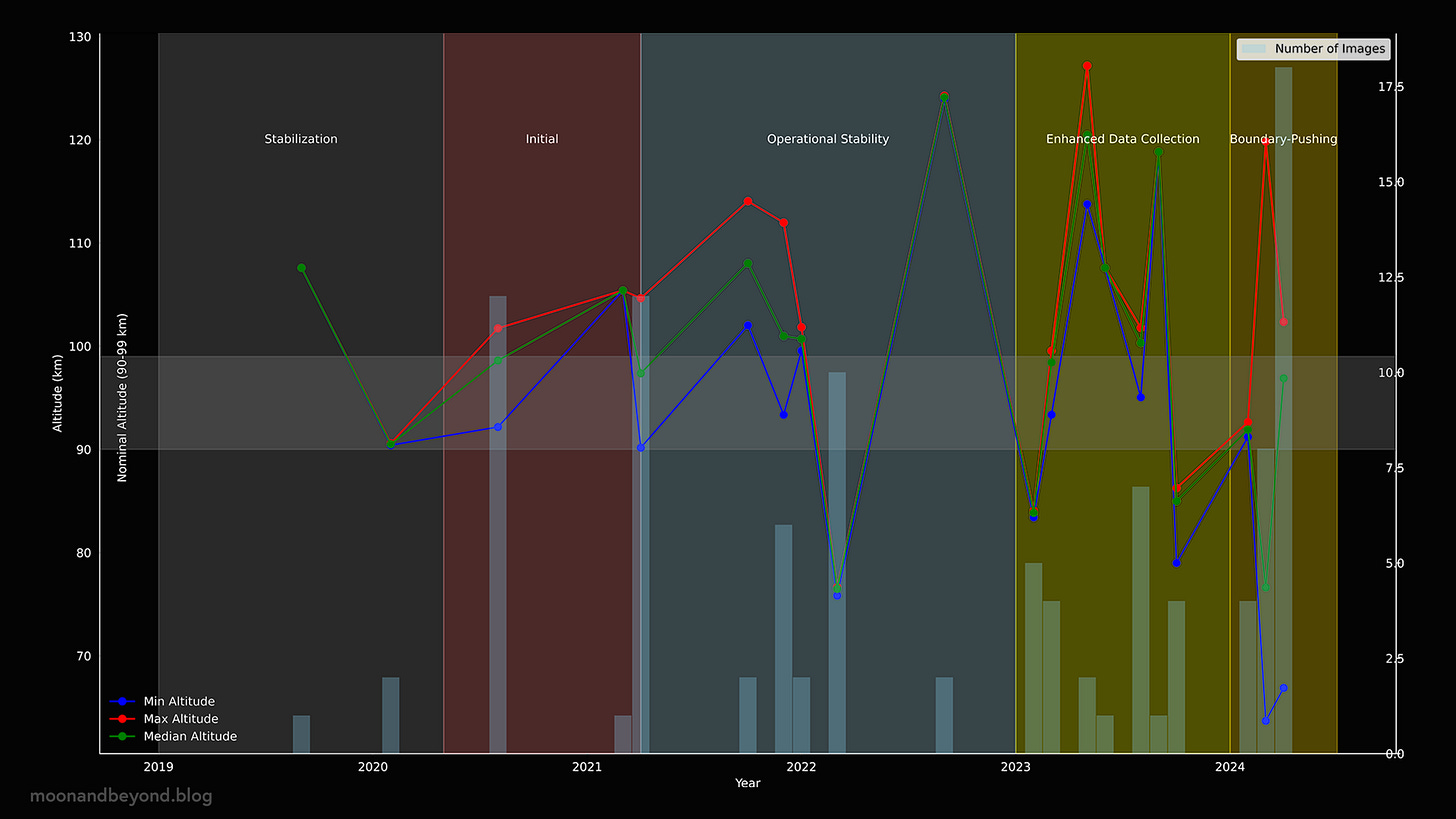
In early 2023, the enhanced data collection phase begins, marked by increased imaging activity and moderate altitude variations, indicating an intensified focus on data acquisition. Early 2024 transitions into the boundary-pushing and adjustment phase, with significant variations in both minimum and maximum altitudes, suggesting extensive operational adjustments and efforts to maximize data collection capabilities. Throughout these phases, the nominal altitude range (90-99 km) serves as a reference for optimal operations, providing a benchmark for evaluating altitude variations. The detailed visualization of these phases highlights ISRO's strategic adjustments to optimize imaging capabilities and supports robust data acquisition for the Chandrayaan 2 mission.
It is noteworthy that ISRO’s SAC is actively recalibrating images from the initial Stabilization phase of the mission. For instance, an image from early September 2019 underwent calibration years later, in 2022 (ch2_ohr_nrp_20190906T1246532096_d_img_d18).
Shift in Focus: Chandrayaan 2 Expands Lunar Studies to the Polar Regions in Preparation for LUPEX
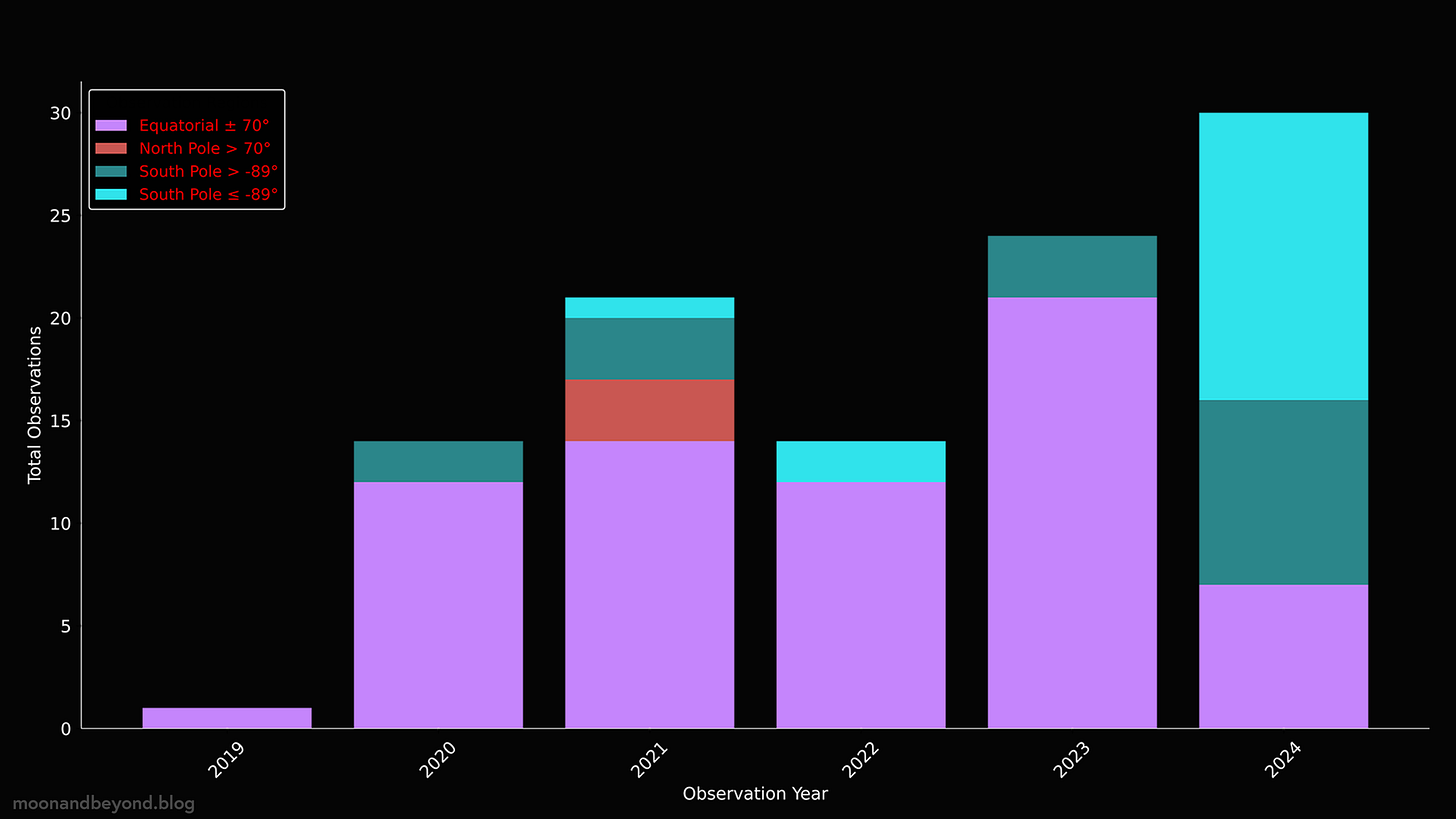
The mission's focus on the equatorial region of the Moon suggests a concentrated effort to study this area. However, the recent imaging from January to April 2024, efforts to identify potential landing sites for the LUPEX mission have already begun, leading to a spike in studying the polar region. Specifically, there were 46 observations made near the poles, with latitudes closer to 1° to the South Pole, under various illumination conditions where solar incidences were as low as 87°.
Evolution of Imaging Stations in the Chandrayaan 2 Mission
Most images are processed at the ISSDC Bangalore (D18) station. Throughout the mission, ISRO has utilized and transitioned among several imaging stations. Initially, operations were centered around SSDC Bangalore (D18) and ISSDC Bangalore (D32). More recently, stations such as ISSDC Bangalore (N18) and hw1 have been introduced. ISSDC Bangalore (N18) has seen increased activity starting in early 2023.
Notably, ISSDC Bangalore (D18) continues to be the primary station, with a peak in usage observed in April 2024. In contrast, hw1 was operational solely during 2021, likely serving as a temporary facility. This strategic evolution in infrastructure underscores ISRO's commitment to enhancing its imaging capabilities and supporting robust data acquisition and analysis for the Chandrayaan 2 mission.
Orbit Keeping & Maintenance: Seasonal and Yearly Analysis of Data Transfer Delays
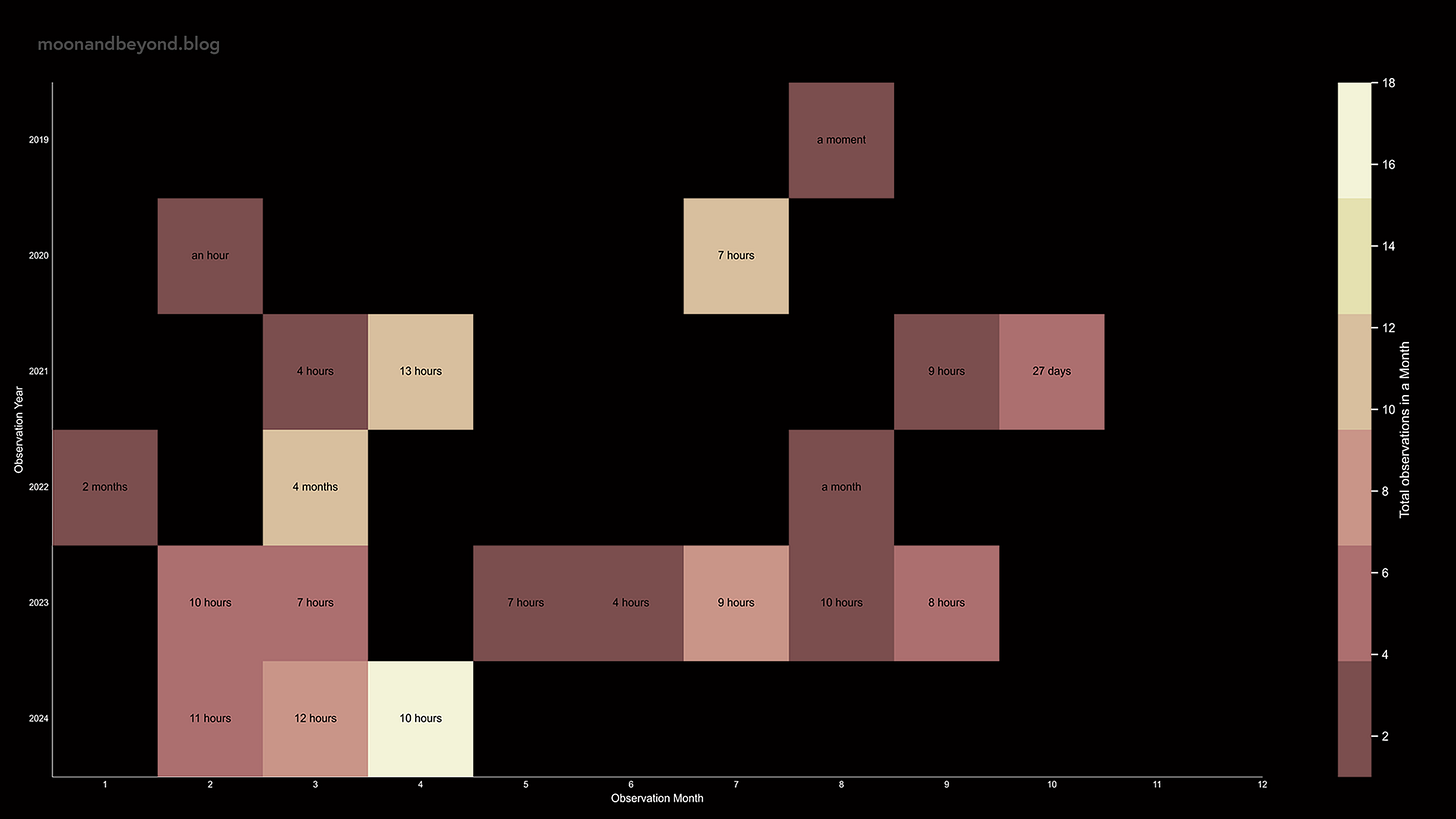
The analysis of data transfer delays highlights significant variability in the time required to transmit data back to Earth. On average, delays are approximately 215 orbits, or about 18 days. However, examining the median delays offers a clearer picture of typical performance, revealing more consistent periods with delays under 1 day, indicative of efficient data handling processes.
Notable peaks, particularly observed in early 2022, suggest abnormal delays extending over to even several weeks! I hypothesise that these delays may be linked to maintenance activities, such as orbit-keeping events. Additionally, certain months, such as June and December, consistently exhibit higher delays, indicating potential seasonal operational challenges or external influences.
Normal delays generally range from a few hours to a few days, with median values under 1 day reflecting efficient data transfer. Abnormal delays, especially those spanning multiple days or aligning with the average delay of 18 days, underscore periods of operational disruptions. The heatmap visualizations effectively illustrate these patterns, highlighting both yearly and monthly trends.
The insights that are presented above are derived after extracting and analyzing all the metadata of the published OHRC images available at the time of writing this article. It is important to note that the scope of these insights falls within this specific frame of reference. The insights presented may or may not accurately reflect the true operations conducted by ISRO/SAC, as detailed information on their activities is currently unavailable. Unfortunately, ISRO has maintained a level of opacity regarding the specifics of their operations, leaving many aspects of their processes as a "black box." Through this article, I attempt to deduce some trends and patterns based on the available data, providing an analysis that may help in understanding the mission's operational dynamics and these are my interpretations based on the available information.
~FIN
[1] Chowdhury, Arup Roy, et al. “Orbiter High Resolution Camera onboard Chandrayaan-2 Orbiter.” Current Science, vol. 118, no. 4, 2020, pp. 560-565. Indian Academy of Sciences, doi:10.18520/cs/v118/i4/560-565 .
[2] Mahanti, Prasun, et al. “Preliminary Characterization of Secondary Illumination at Shackleton Crater Permanently Shadowed Region from ShadowCam Observations and Modeling.” Journal of Astronomical and Space Sciences, vol. 40, no. 4, 2023, pp. 131-148. Korean Space Science Society, doi:10.5140/JASS.2023.40.4.131
[3] Amitabh, Ashutosh Gupta, K. Suresh, Ajay K. Prashar, Kannan V. Iyer, Abdullah Suhail A. Z., Shweta Verma, Baharul Islam B., Hemant K. Lalwani, and T. P. Srinivasan. “High Resolution DEM Generation from Chandrayaan-2 Orbiter High Resolution Camera Images.”
[4] Amitabh, K. Suresh, Ajay K. Prashar, and Abdullah Suhail A. Z. "Terrain Characterization of Potential Landing Sites for Chandrayaan-3 Lander using Orbiter High Resolution Camera (OHRC) Images."


